

Test results are more than just "green/red" in CI logs. Behind every run lies a story: which tests break most often, where performance degrades, which errors keep recurring. The problem is that standard terminal output doesn't answer these questions.
Qase Report is an open-source CLI tool that transforms test results into an interactive HTML report with a dashboard, analytics, screenshot gallery, and run history. A single file you can open in a browser without a server — and share with a colleague or attach to a ticket.
In this article, we'll walk through how to install and use Qase Report: from first launch to trend analysis across dozens of runs.
Installation
Qase Report is distributed as an npm package and requires Node.js 18+.
npm install -g qase-report
Verify the installation:
qase-report --help
You'll see two main commands: open and generate. More on each below.
Preparing Data
Qase Report works with data in the Qase Report Format. If you use Qase reporters for pytest, Playwright, Jest, Cypress, or other frameworks — the data is generated automatically.
The results directory structure looks like this:
results/
├── run.json              # Run metadata and statistics
├── results/
│   ├── {uuid-1}.json     # Individual test result
│   ├── {uuid-2}.json
│   └── ...
├── attachments/          # Screenshots, logs, files
│   └── ...
└── qase-report-history.json  # Optional: run history
The run.json file contains general run information: title, environment, execution time, and status statistics. Each file in results/ describes a single test case with its steps, attachments, and metadata.
Quick Start: Opening a Report
The simplest way to view a report is the open command. It starts a local server and opens the report in your browser:
qase-report open ./results
The browser will open automatically at http://localhost:3000. You'll immediately see the test list for the current run.
If port 3000 is already in use, specify a different one:
qase-report open ./results -p 8080
Generating Static HTML
For sharing or archiving, it's more convenient to generate a standalone HTML file:
qase-report generate ./results -o report.html
The resulting file contains everything: the application code, styles, and test data. You can open it with a double-click in any browser — no server required. This is useful for:
- Attaching to tickets in Jira or GitHub Issues
- Sending to colleagues via email or Slack
- Archiving as CI/CD artifacts
Interface Overview
The report consists of several sections, accessible via tabs at the top of the screen.
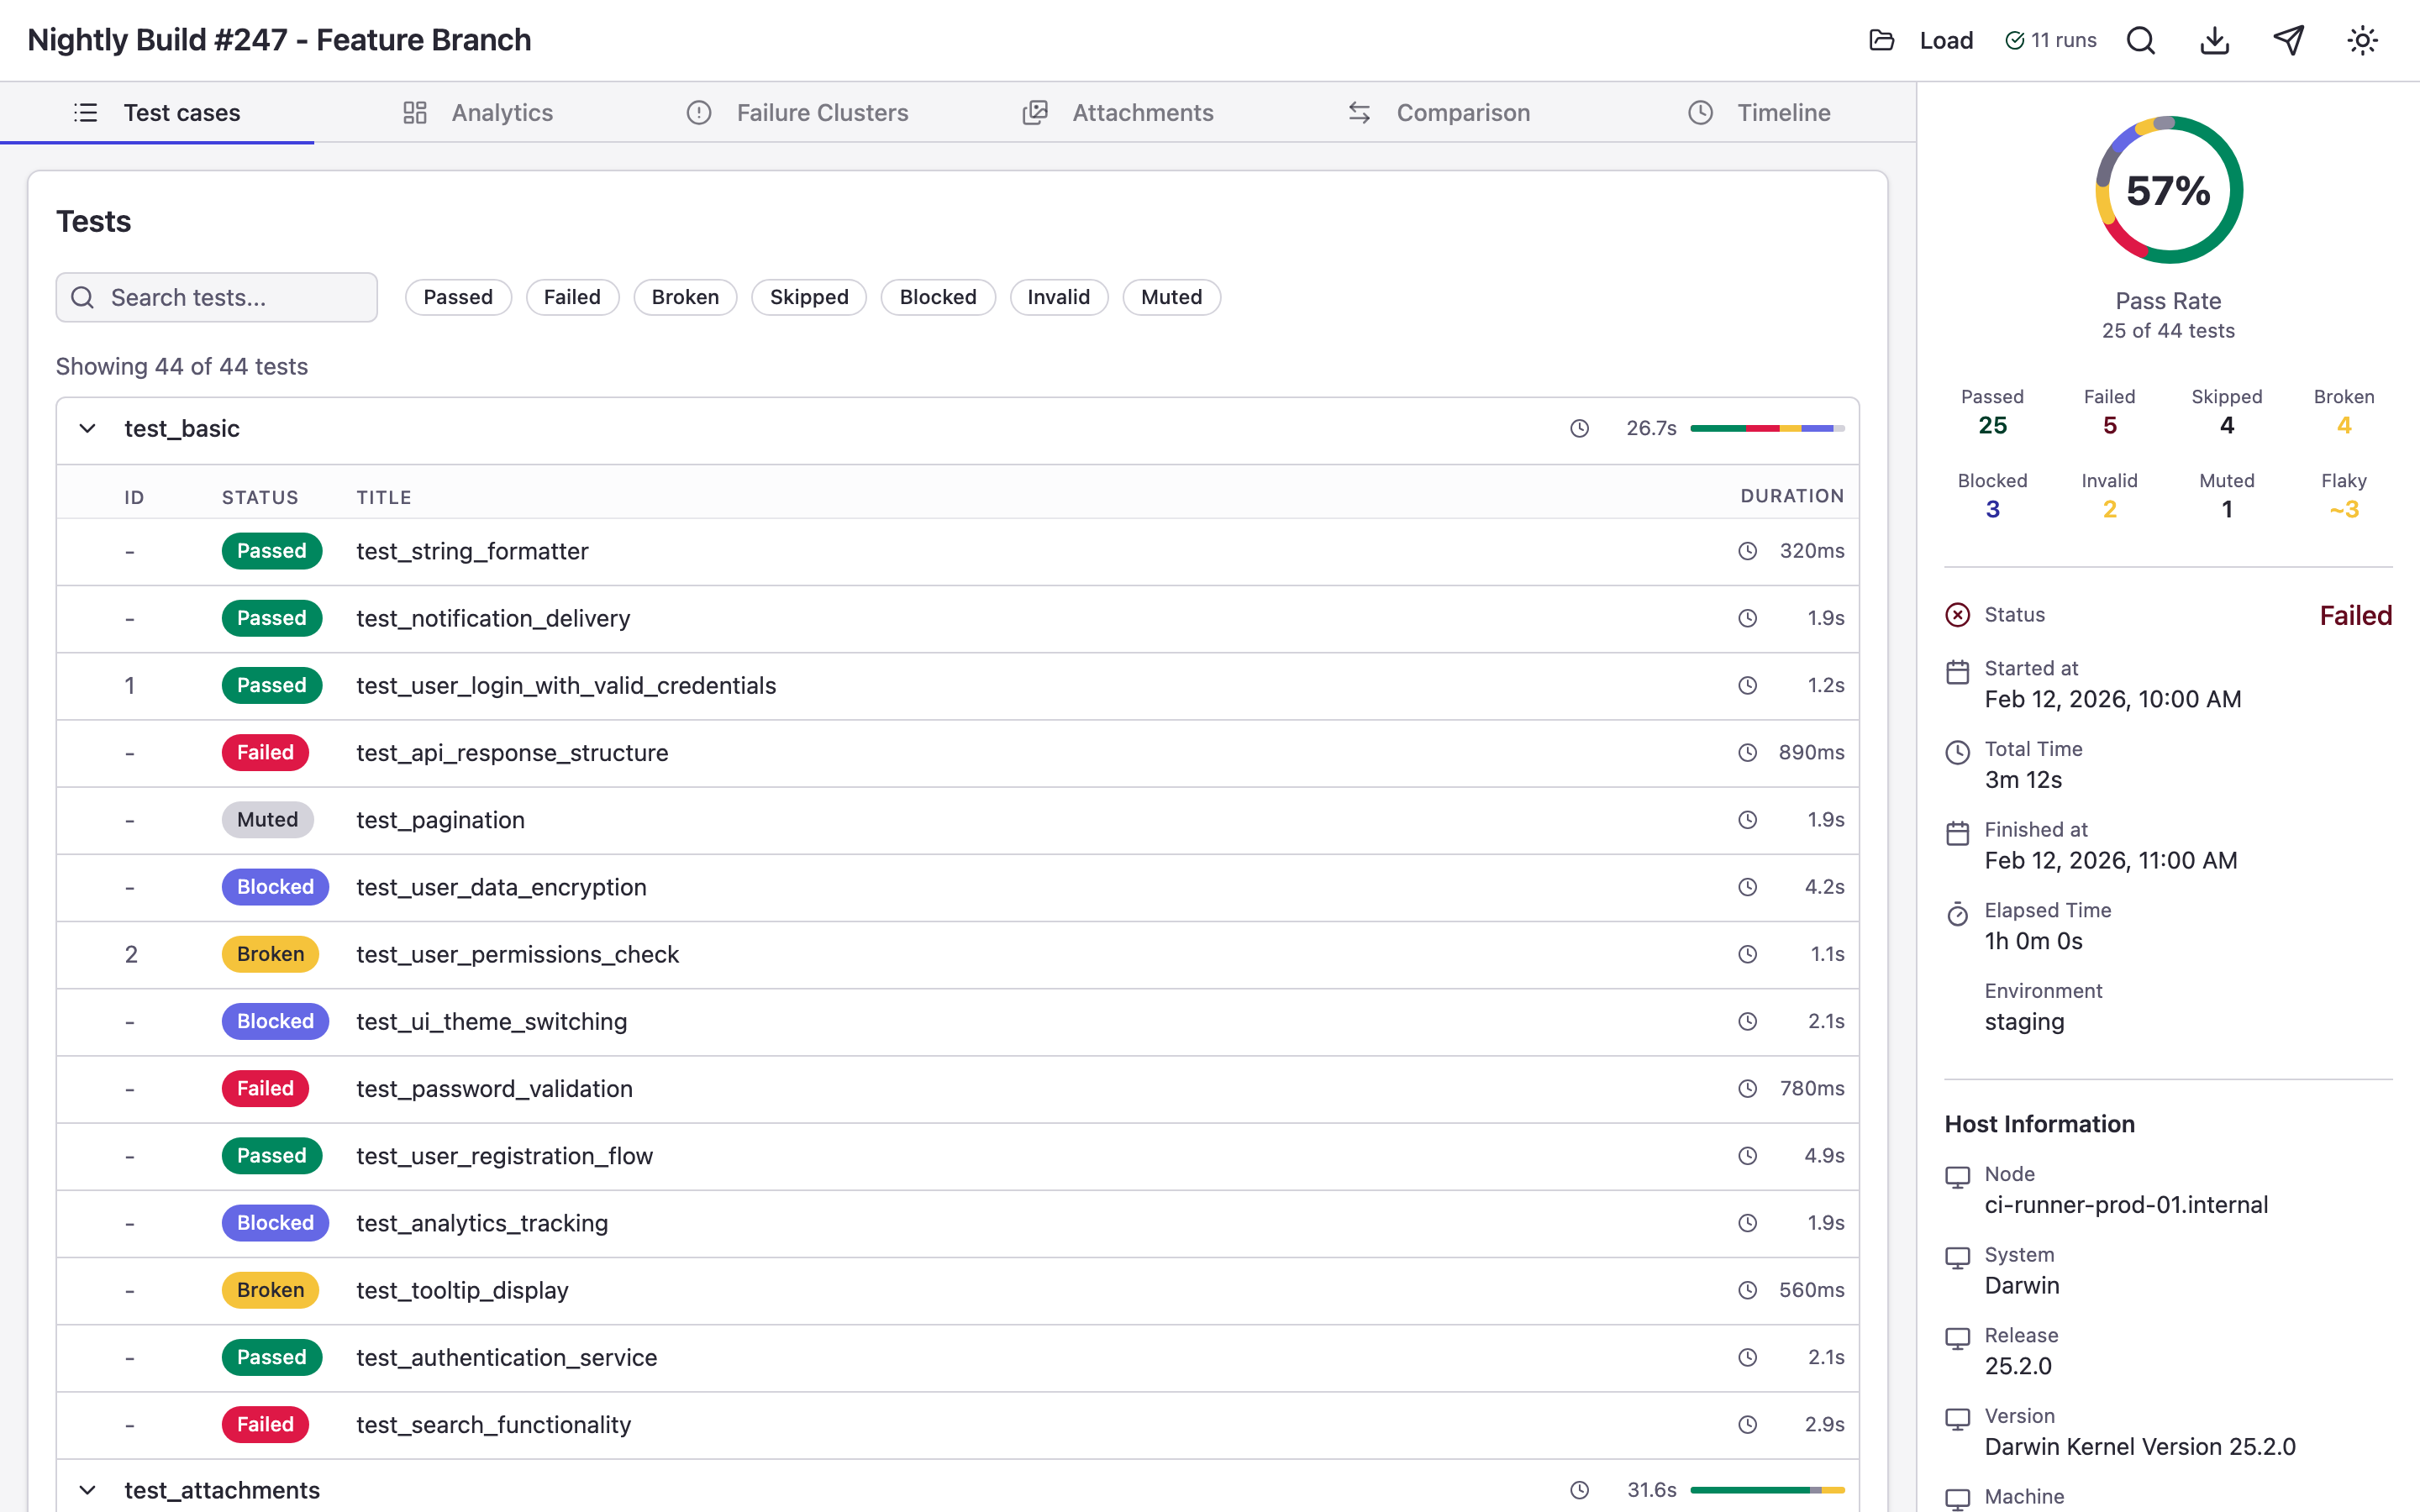
Test Cases — Test List
This is the default view that opens first. Tests are organized in a suite hierarchy that you can expand and collapse.
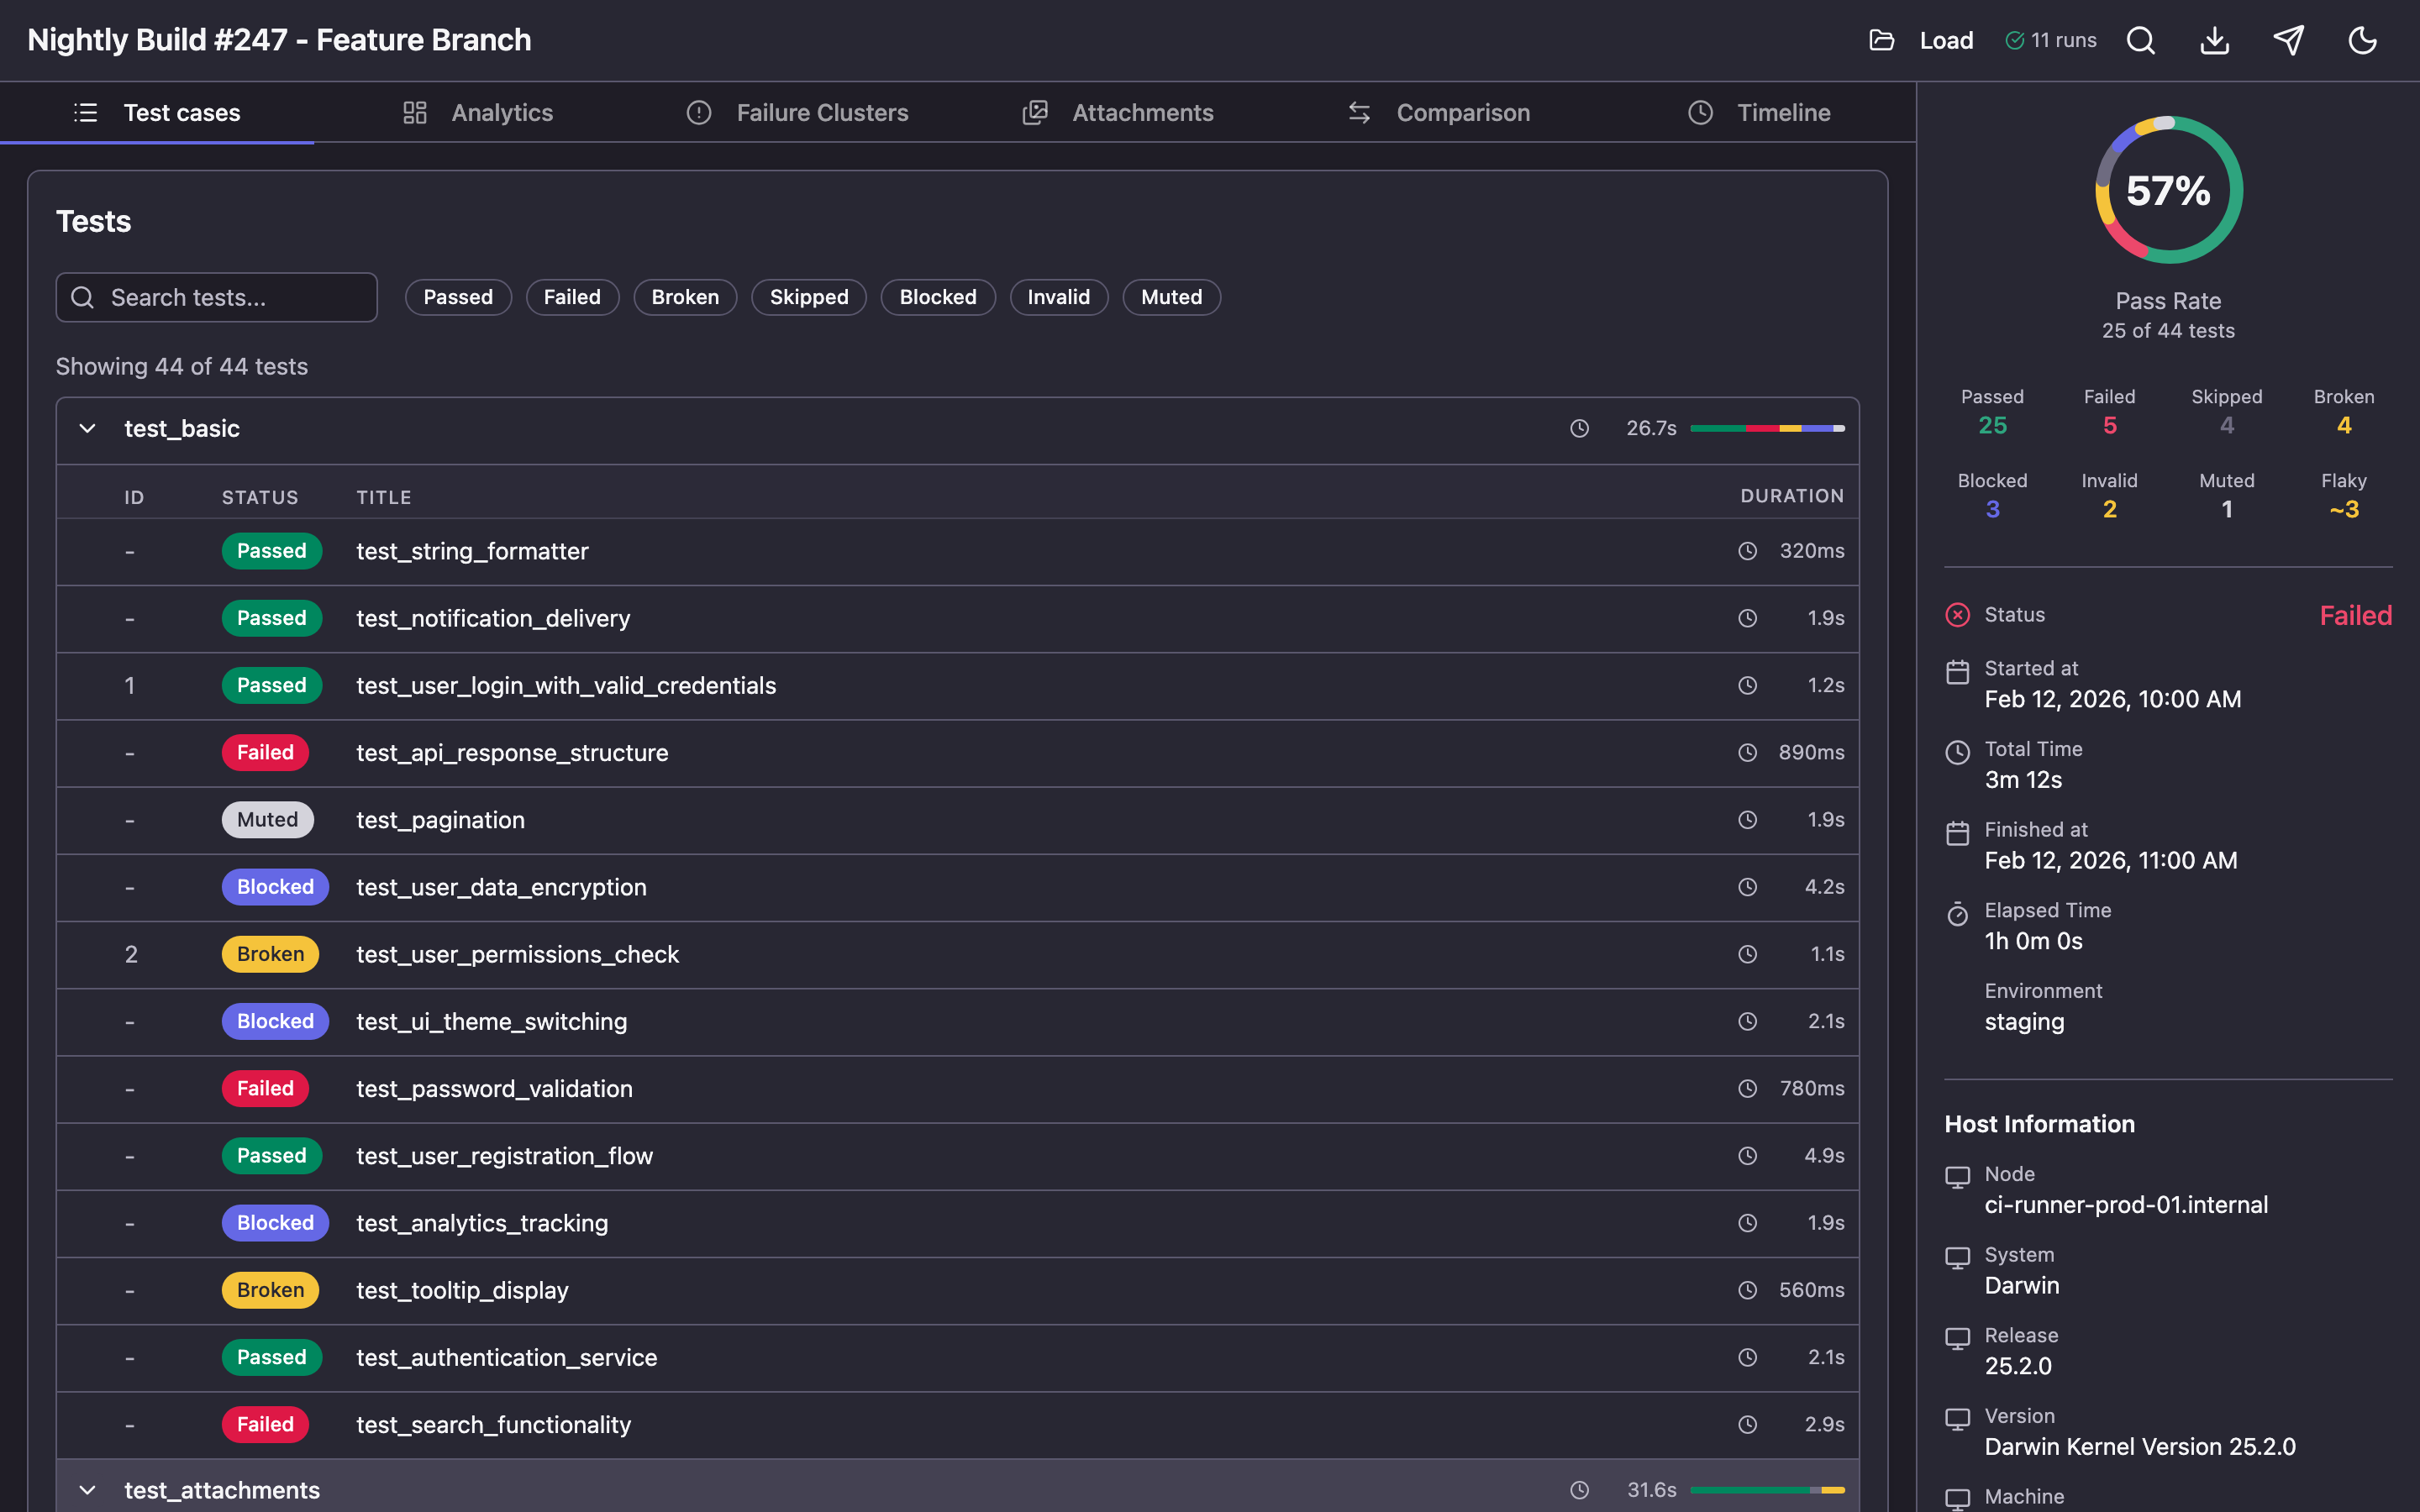
Each test displays its status, duration, and stability grade. Available statuses:
| Status | Description |
|---|---|
| passed | Test completed successfully |
| failed | Test failed on assertion |
| broken | Test crashed due to a code or environment error |
| skipped | Test was skipped |
| blocked | Test was blocked by an external dependency |
| invalid | Invalid test configuration |
| muted | Test failures are ignored |
Above the list are status filters and a search field for finding tests by name.

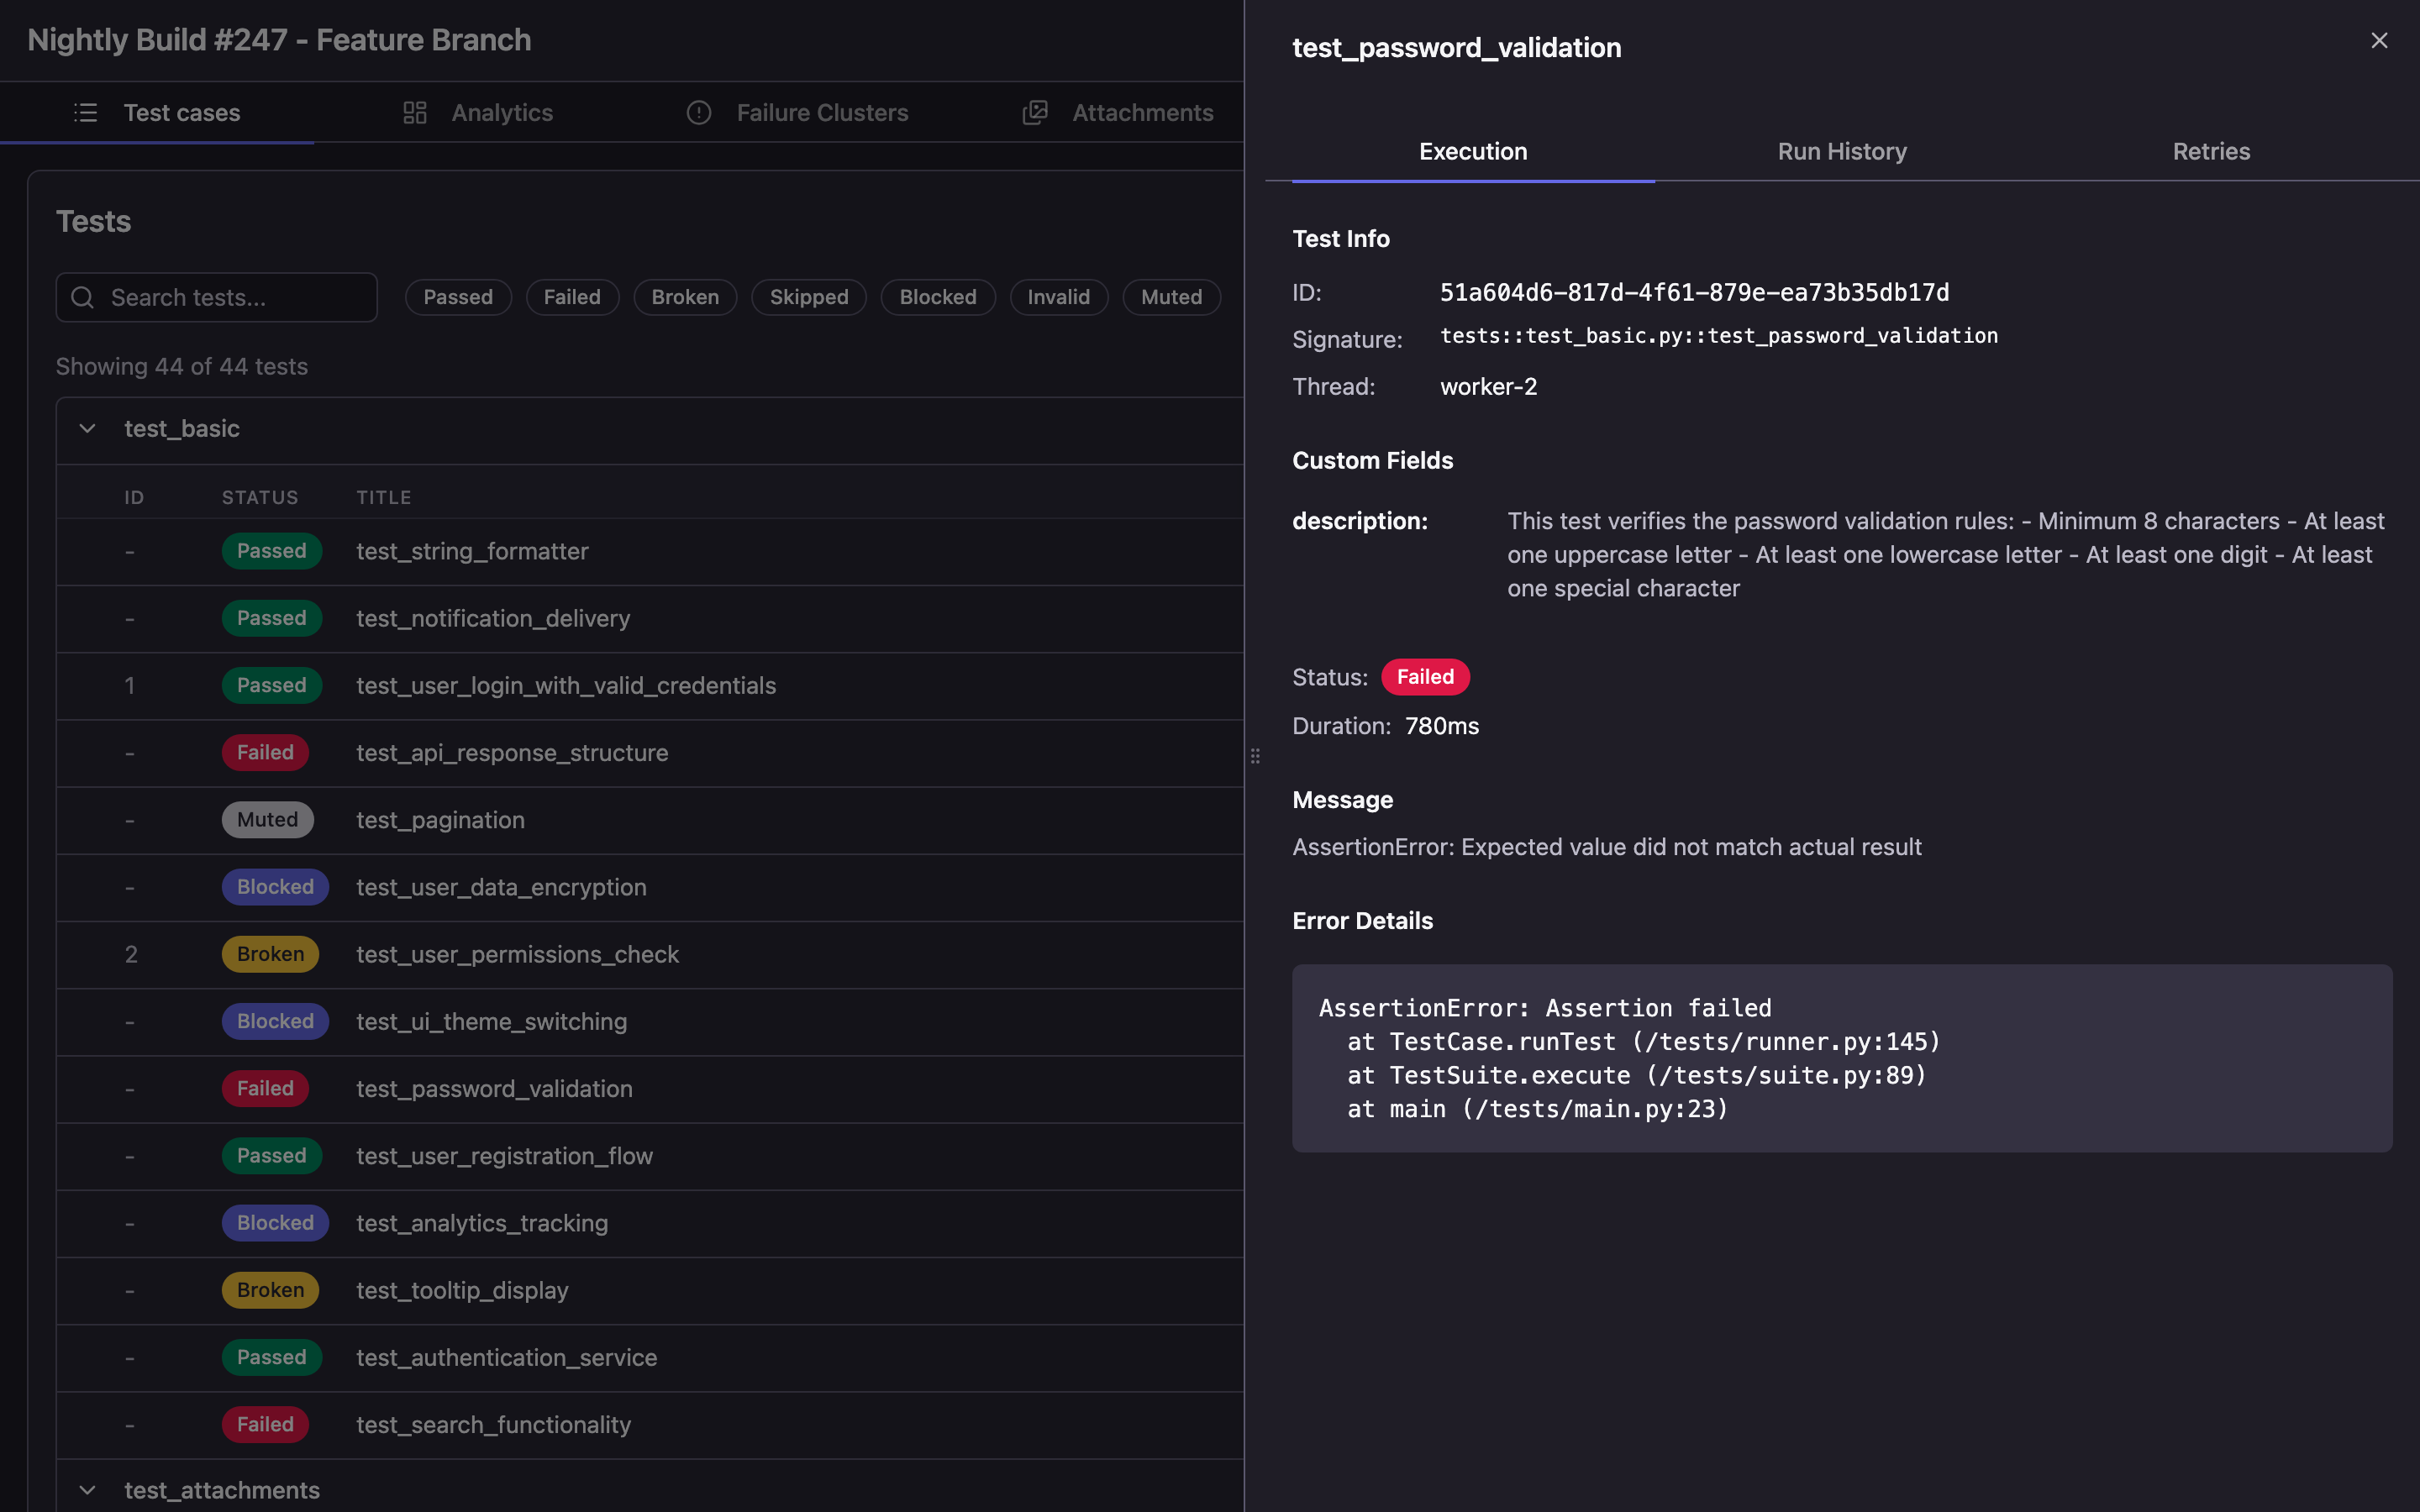
Click on a test to open its details in a side panel: execution steps, error stacktrace, attachments, and parameters.
Analytics — Dashboard
The Analytics tab is an interactive bento-grid dashboard with key run metrics.
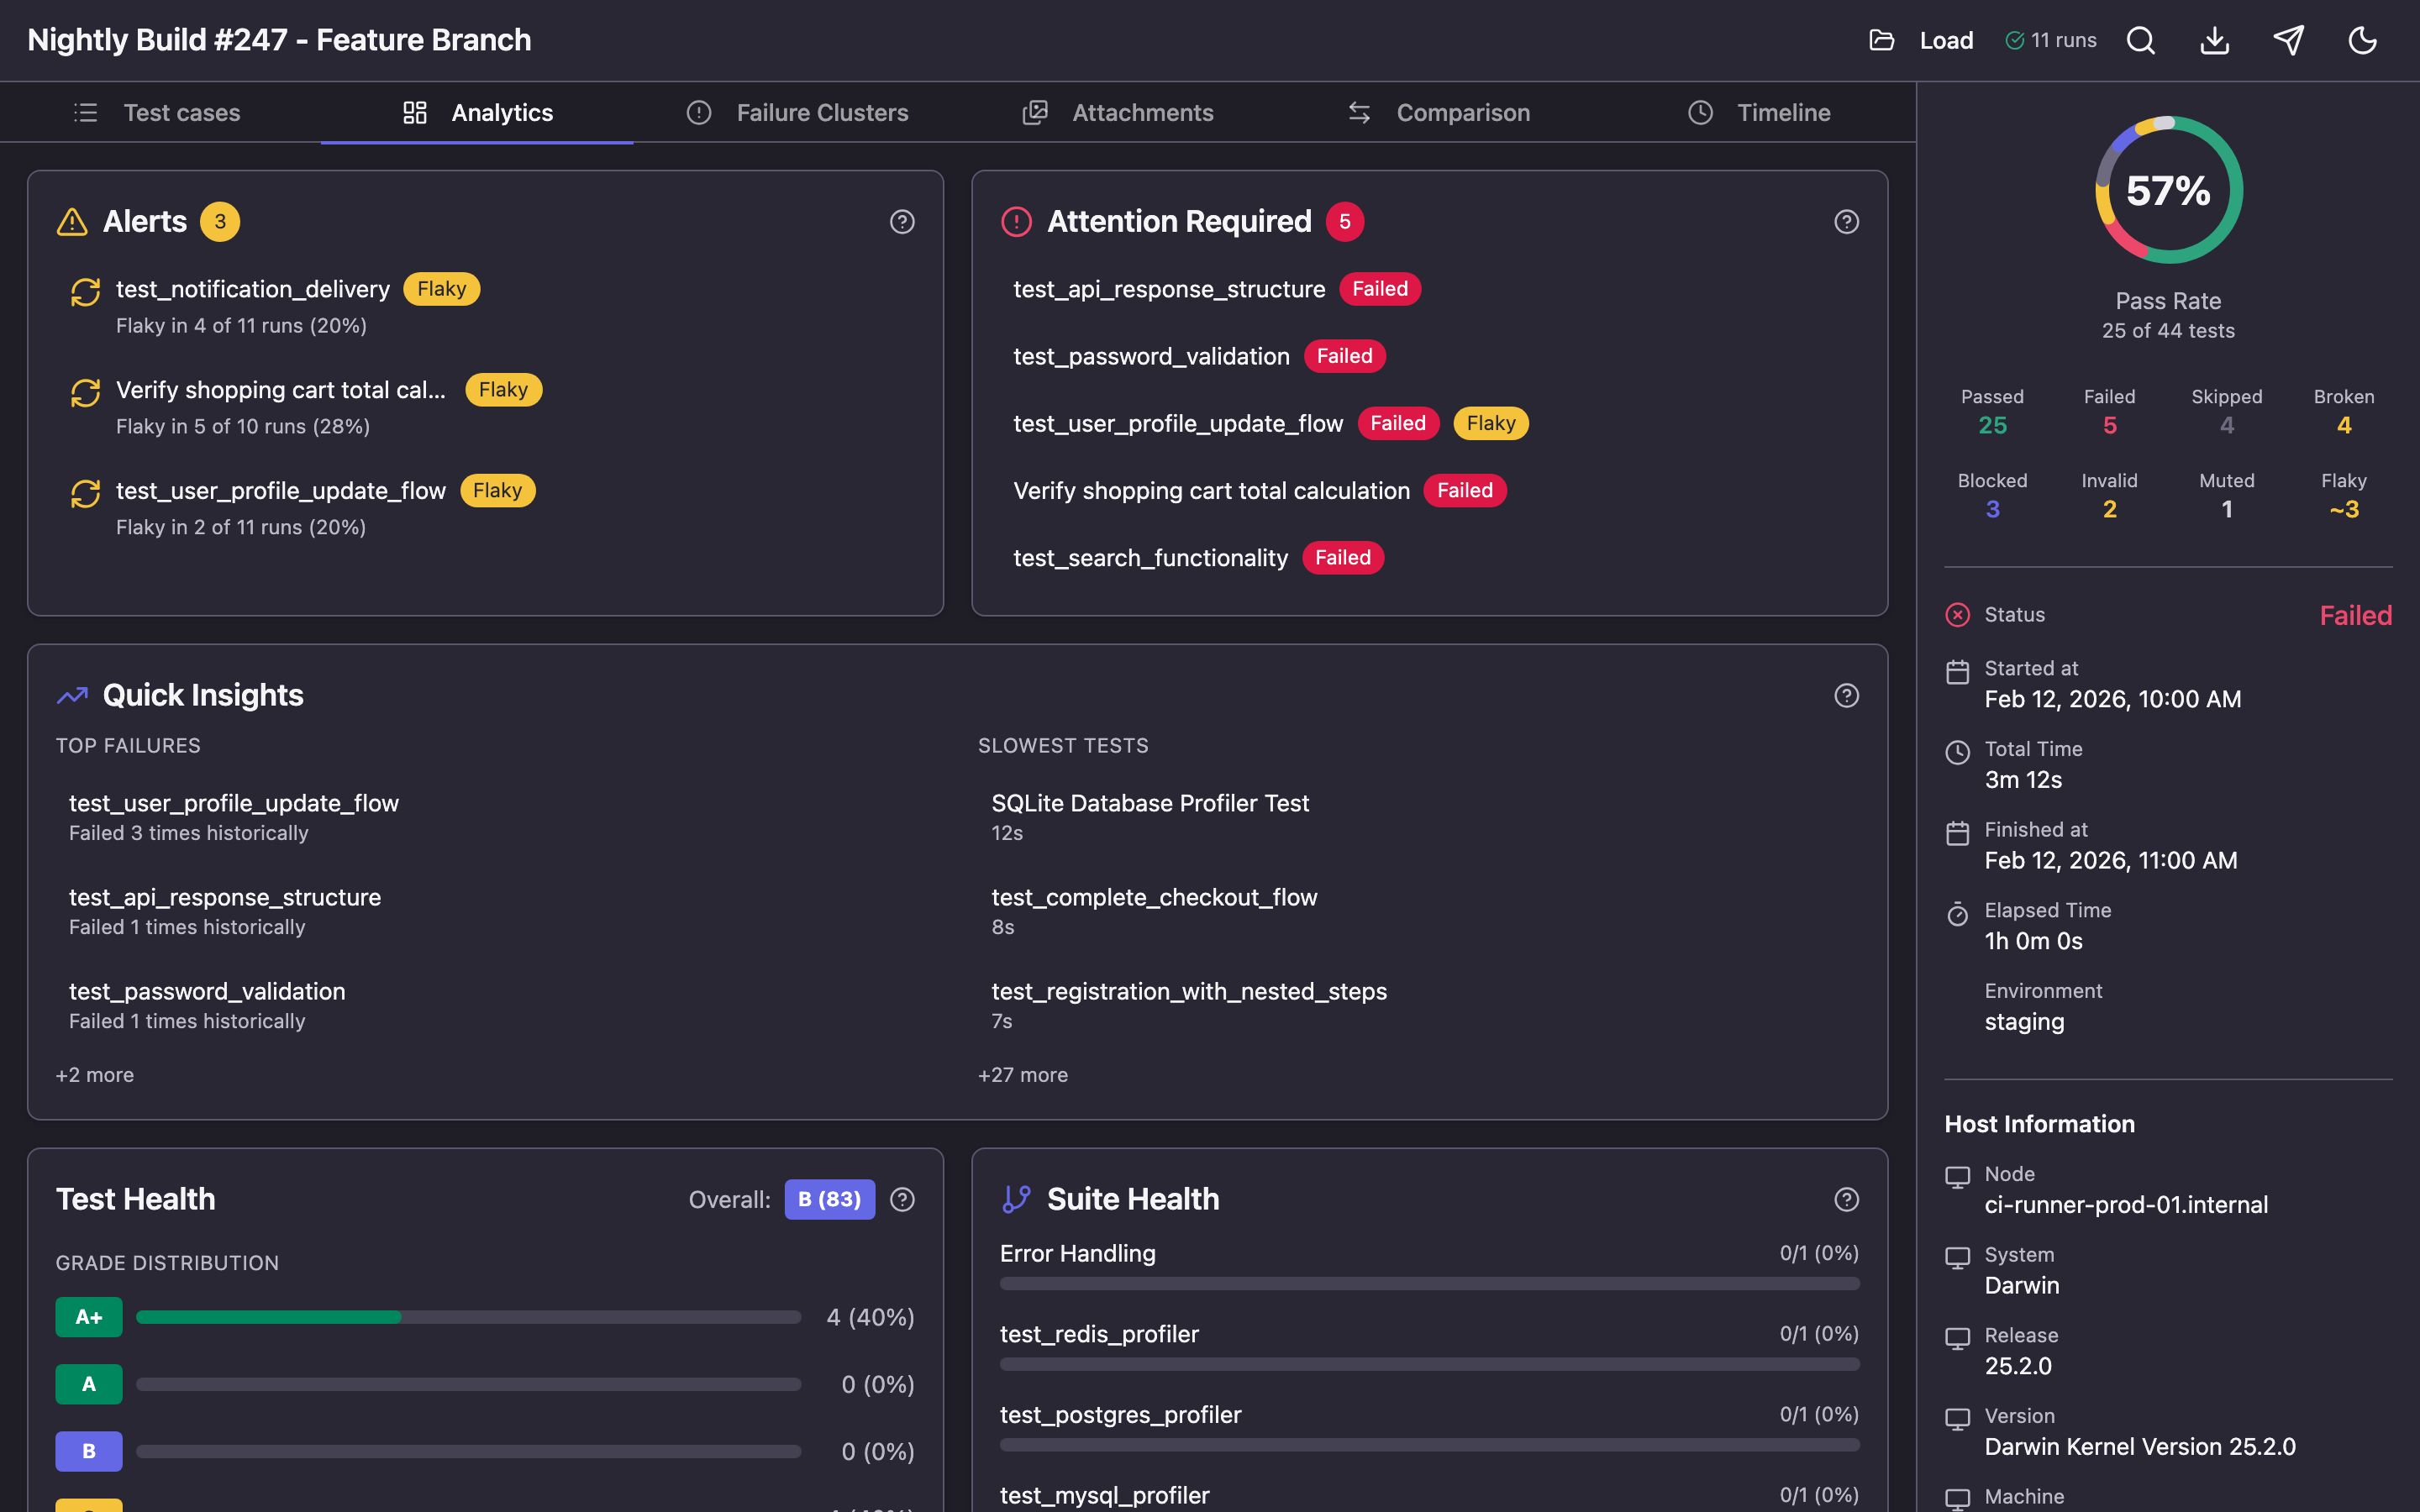
Here you'll find:
- Alerts — notifications about flaky tests and regressions
- Attention Required — tests that need attention: unstable, slow, new failures
- Quick Insights — top failing tests and slowest tests
- Test Health — stability grade for each test on an A+ to F scale
- Suite Health — pass rate by suite
When run history is connected (more on this in the next section), the dashboard is enriched with trends:
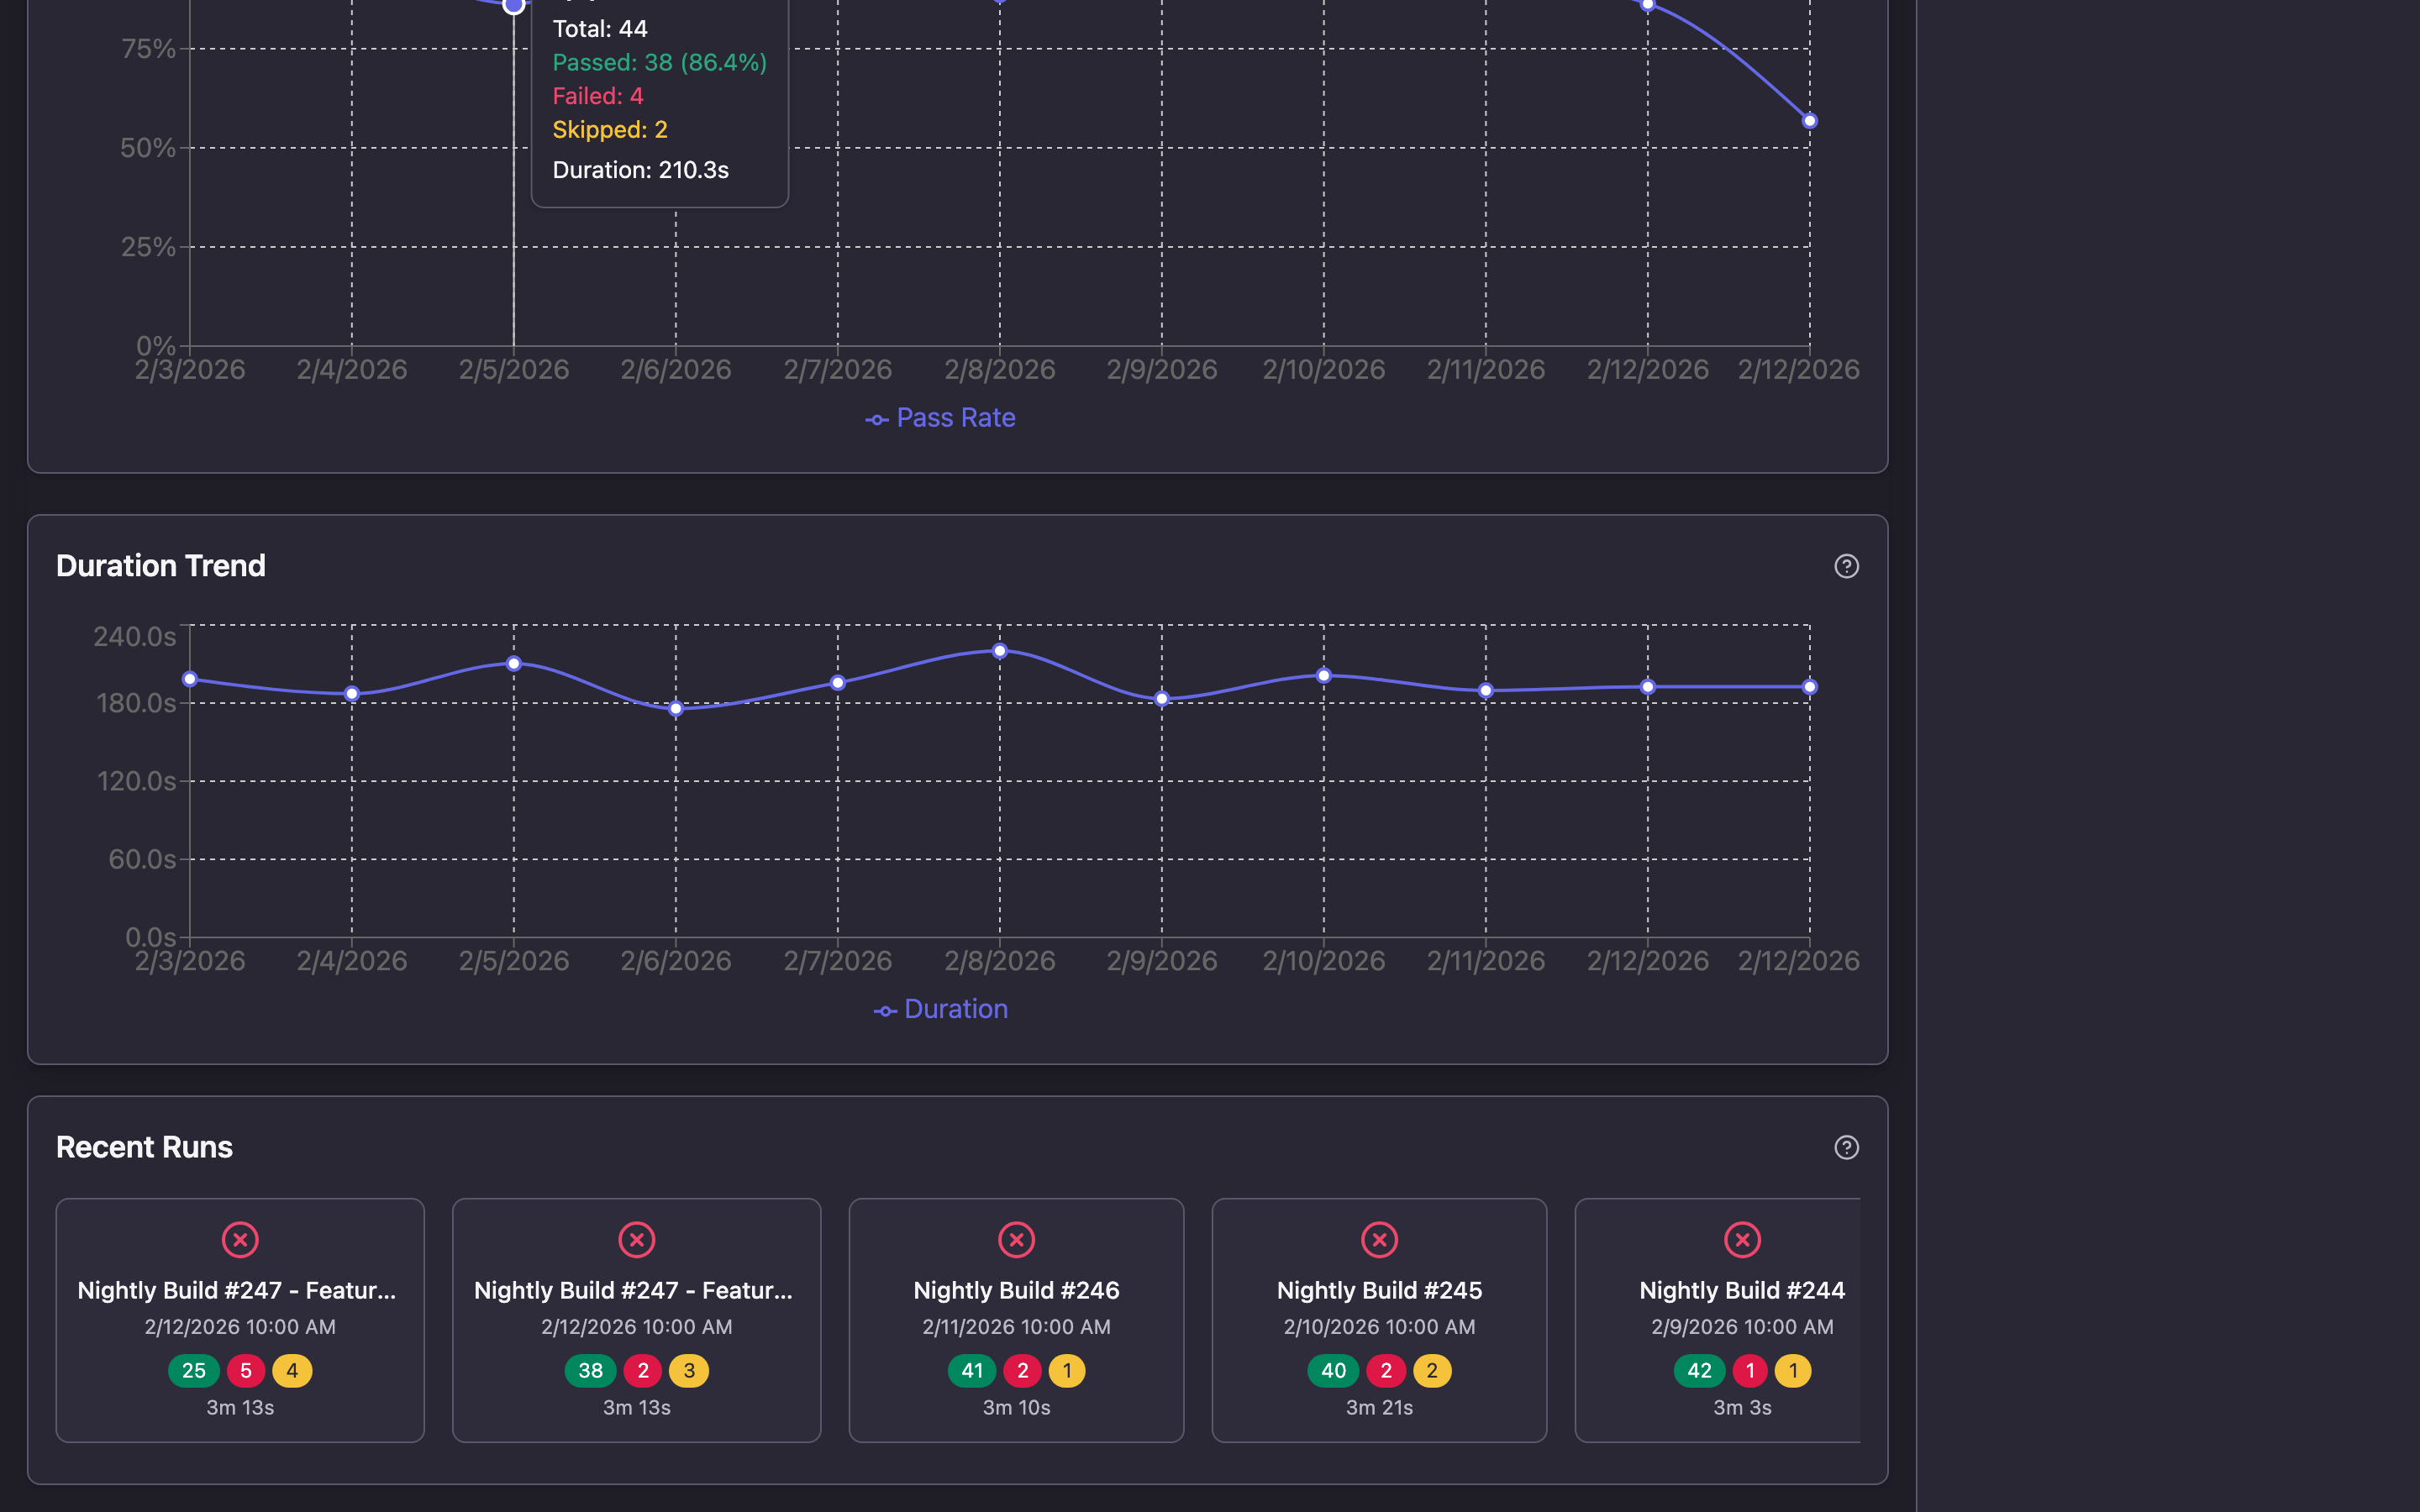
- Pass Rate Trends — pass rate trend chart across runs
- Duration Trends — execution time changes over time
- Recent Runs — cards for recent runs with summary statistics
Failure Clusters — Error Clustering
When multiple tests fail with the same error, the Failure Clusters section automatically groups them together.
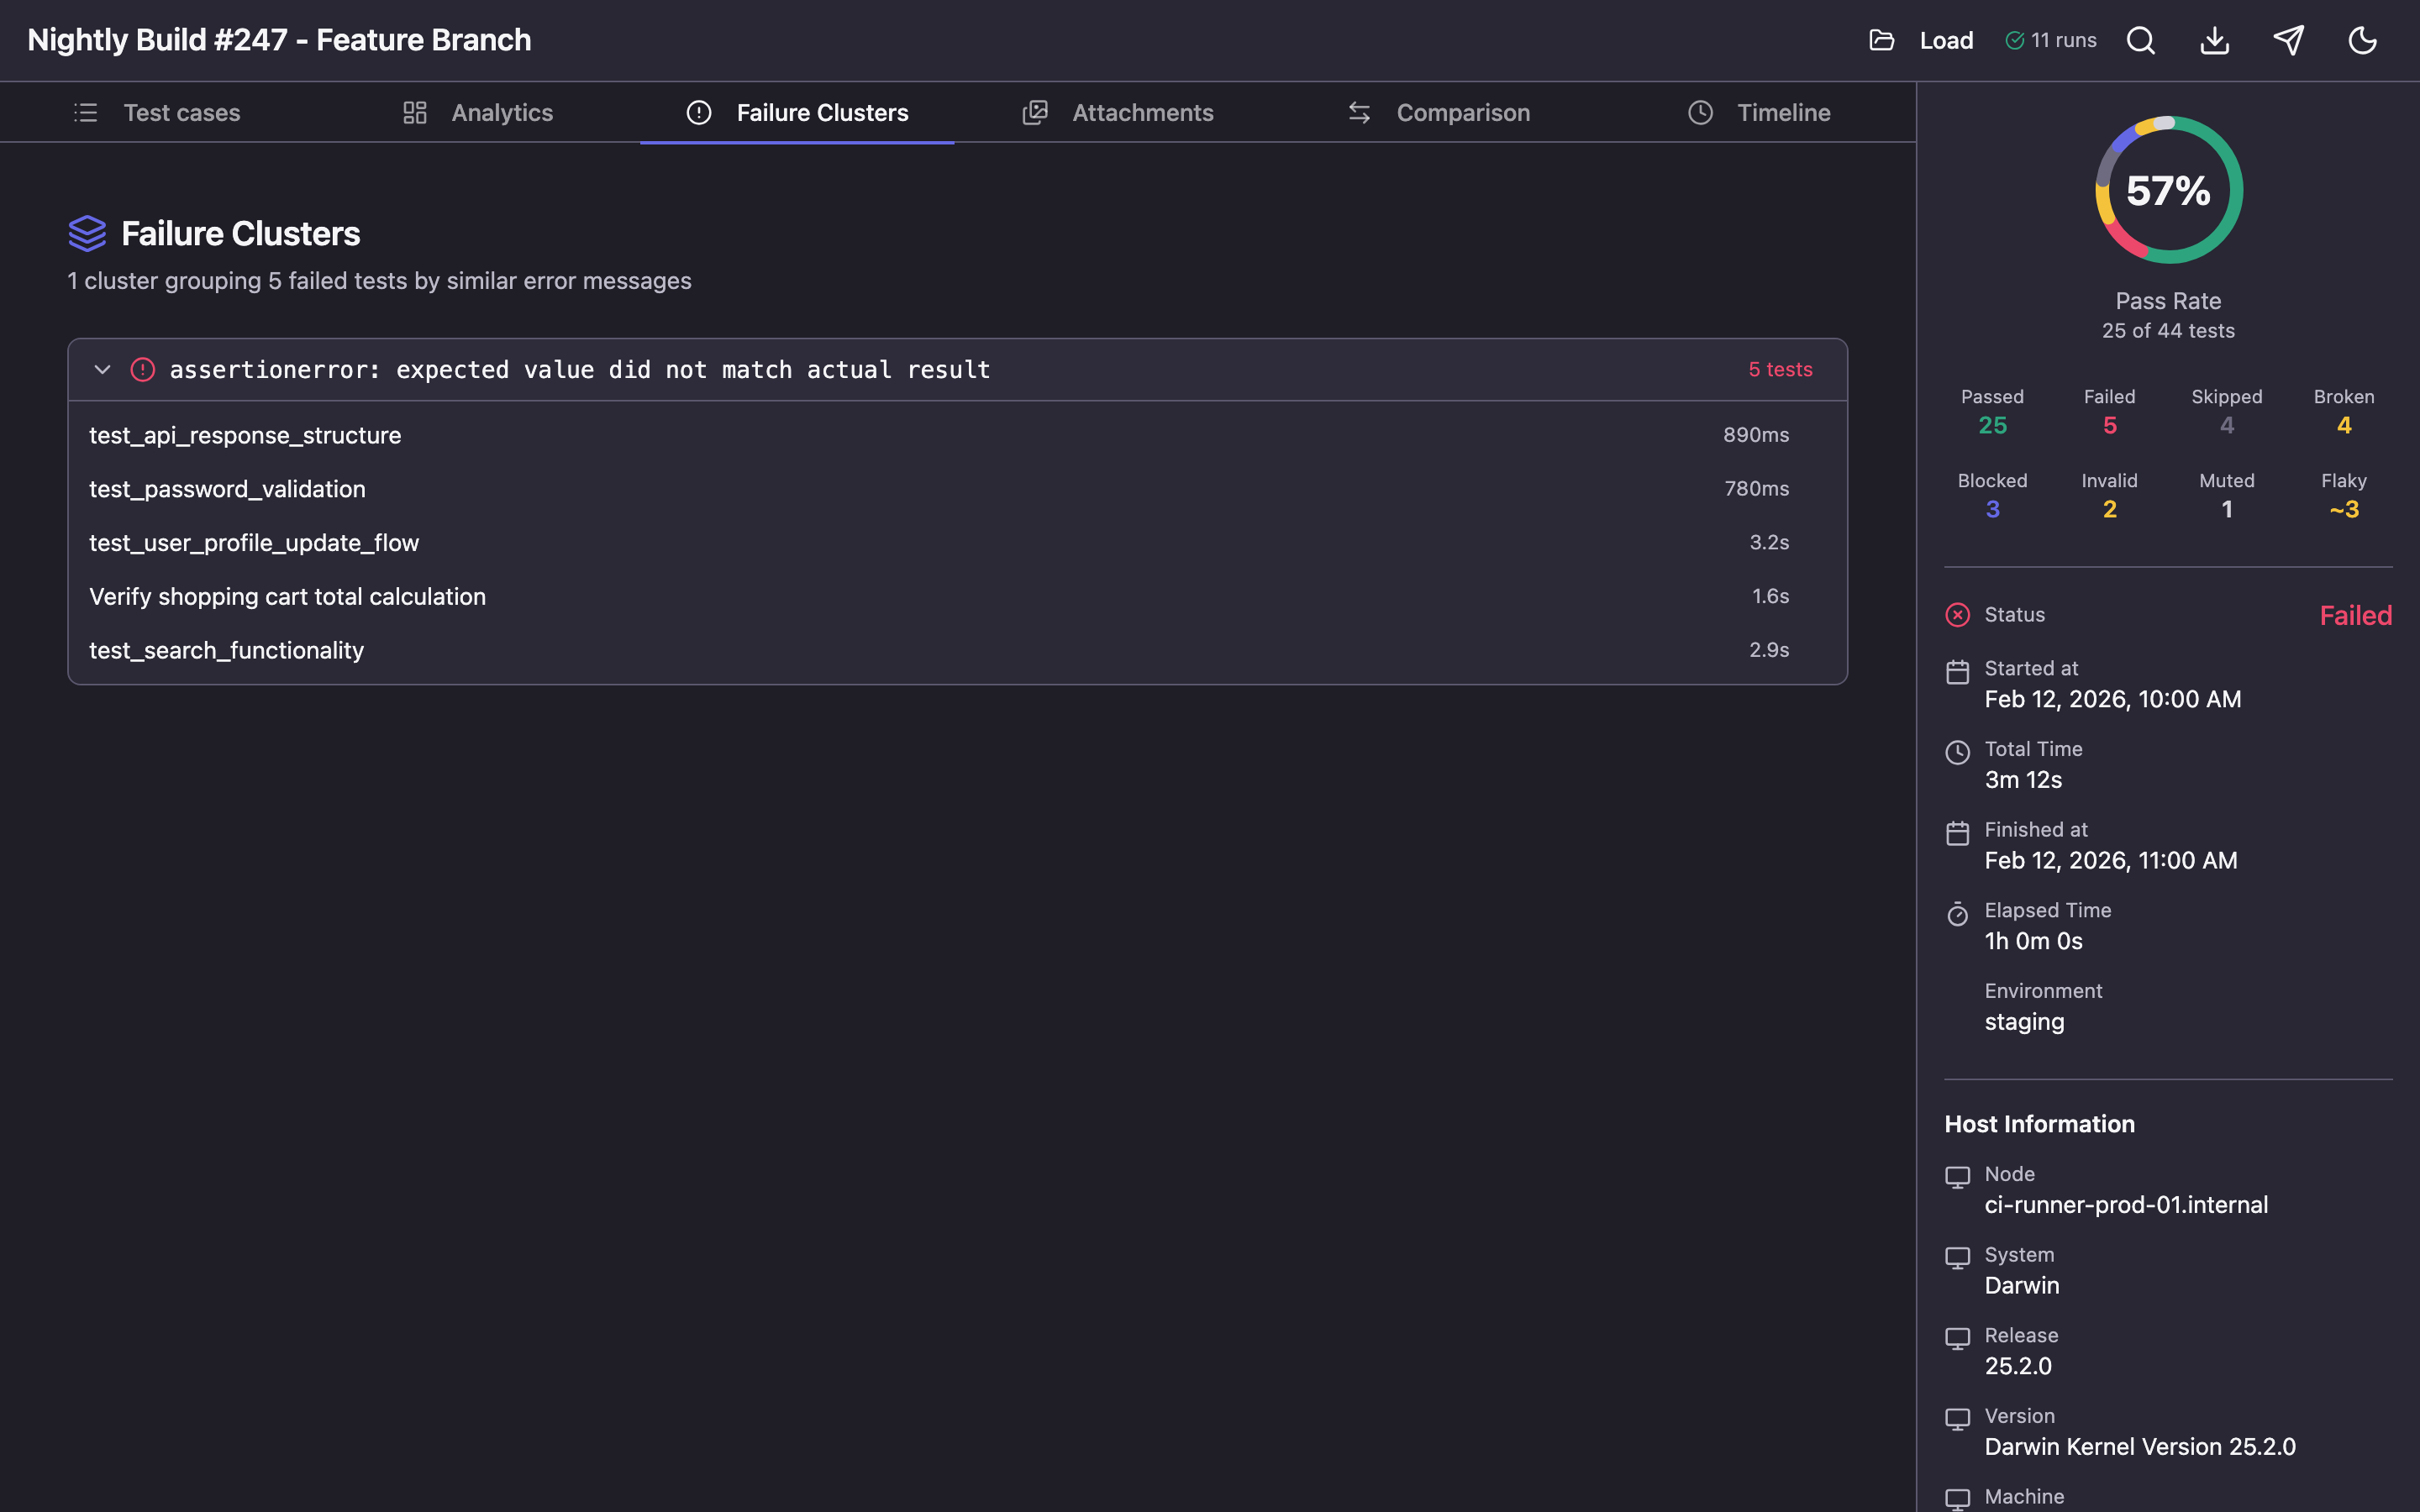
This helps quickly understand the scope of a problem: if 15 tests failed with the same ConnectionRefusedError, the cause is likely infrastructure, not the tests themselves.
Attachments — Attachment Gallery
All screenshots, logs, and files attached to tests are gathered in one place.
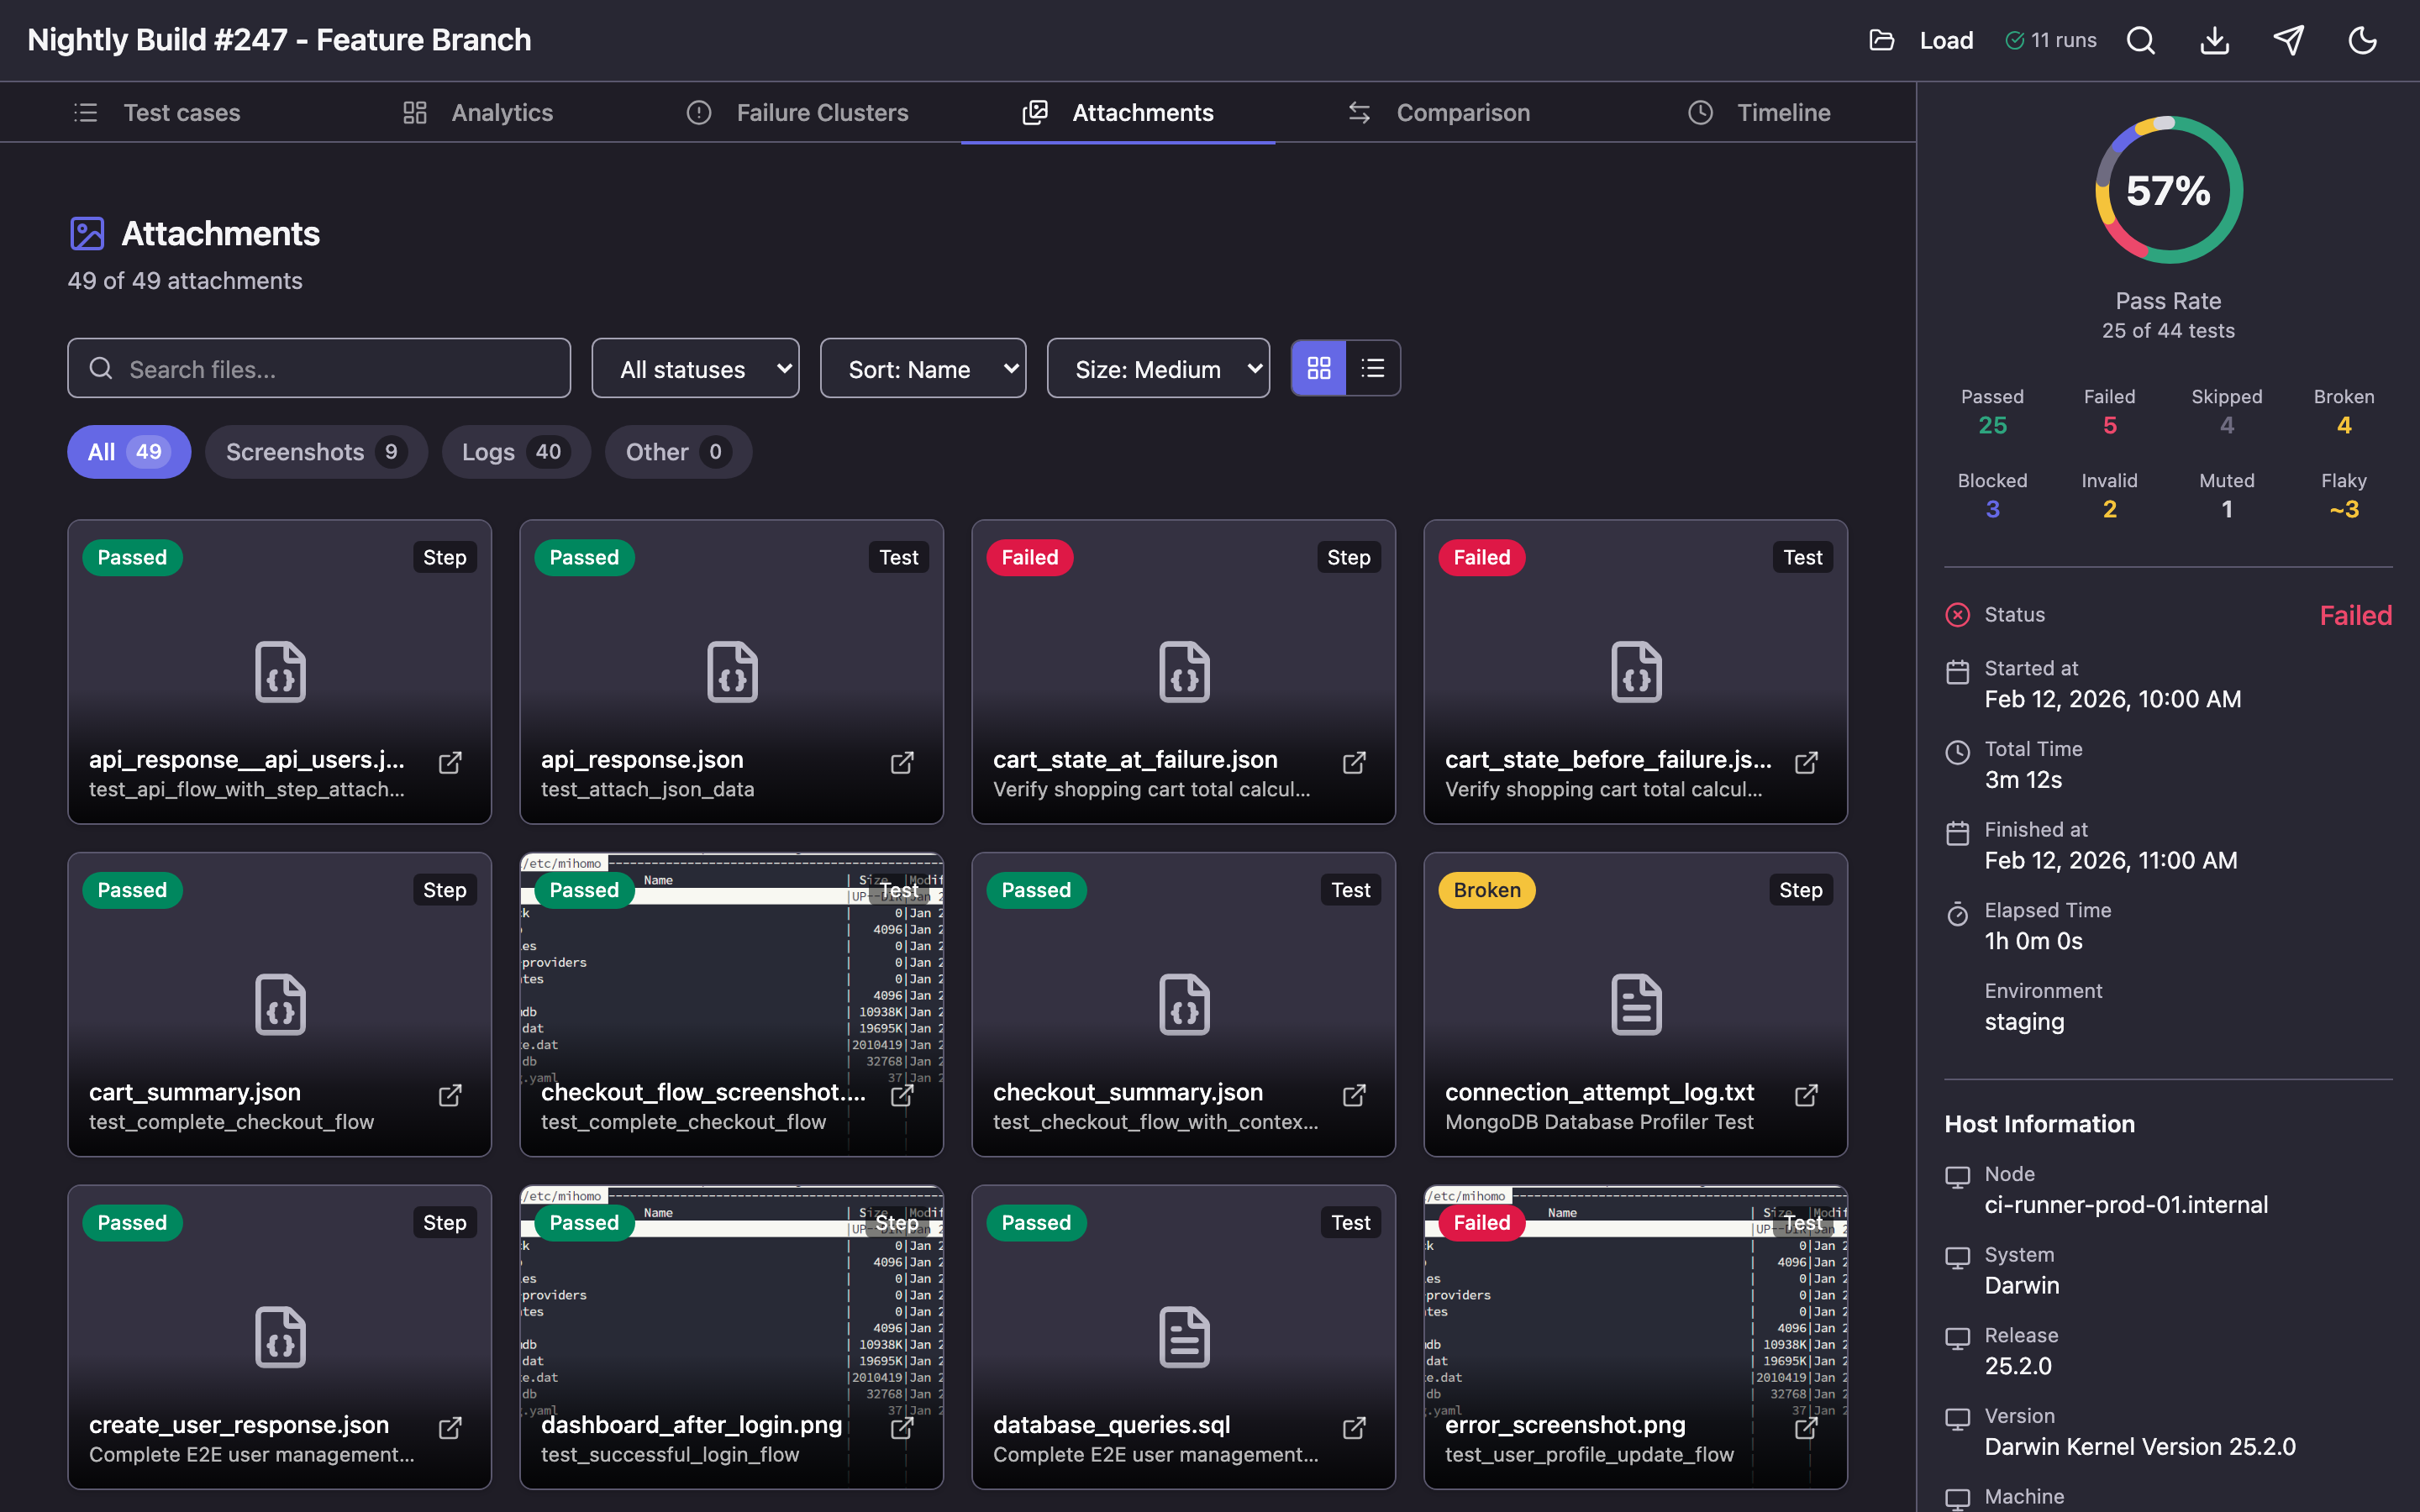
Available features:
- Filtering by category (screenshots, logs, other files) and test status
- Sorting by name, date, size
- Two display modes: grid with adjustable tile sizes and list
- Full-screen screenshot viewing with zoom and navigation
- Search by file name
Timeline — Execution Visualization
The Timeline section shows how tests were executed over time. Each thread (worker) is displayed as a separate swimlane, and tests appear as colored bars with duration.
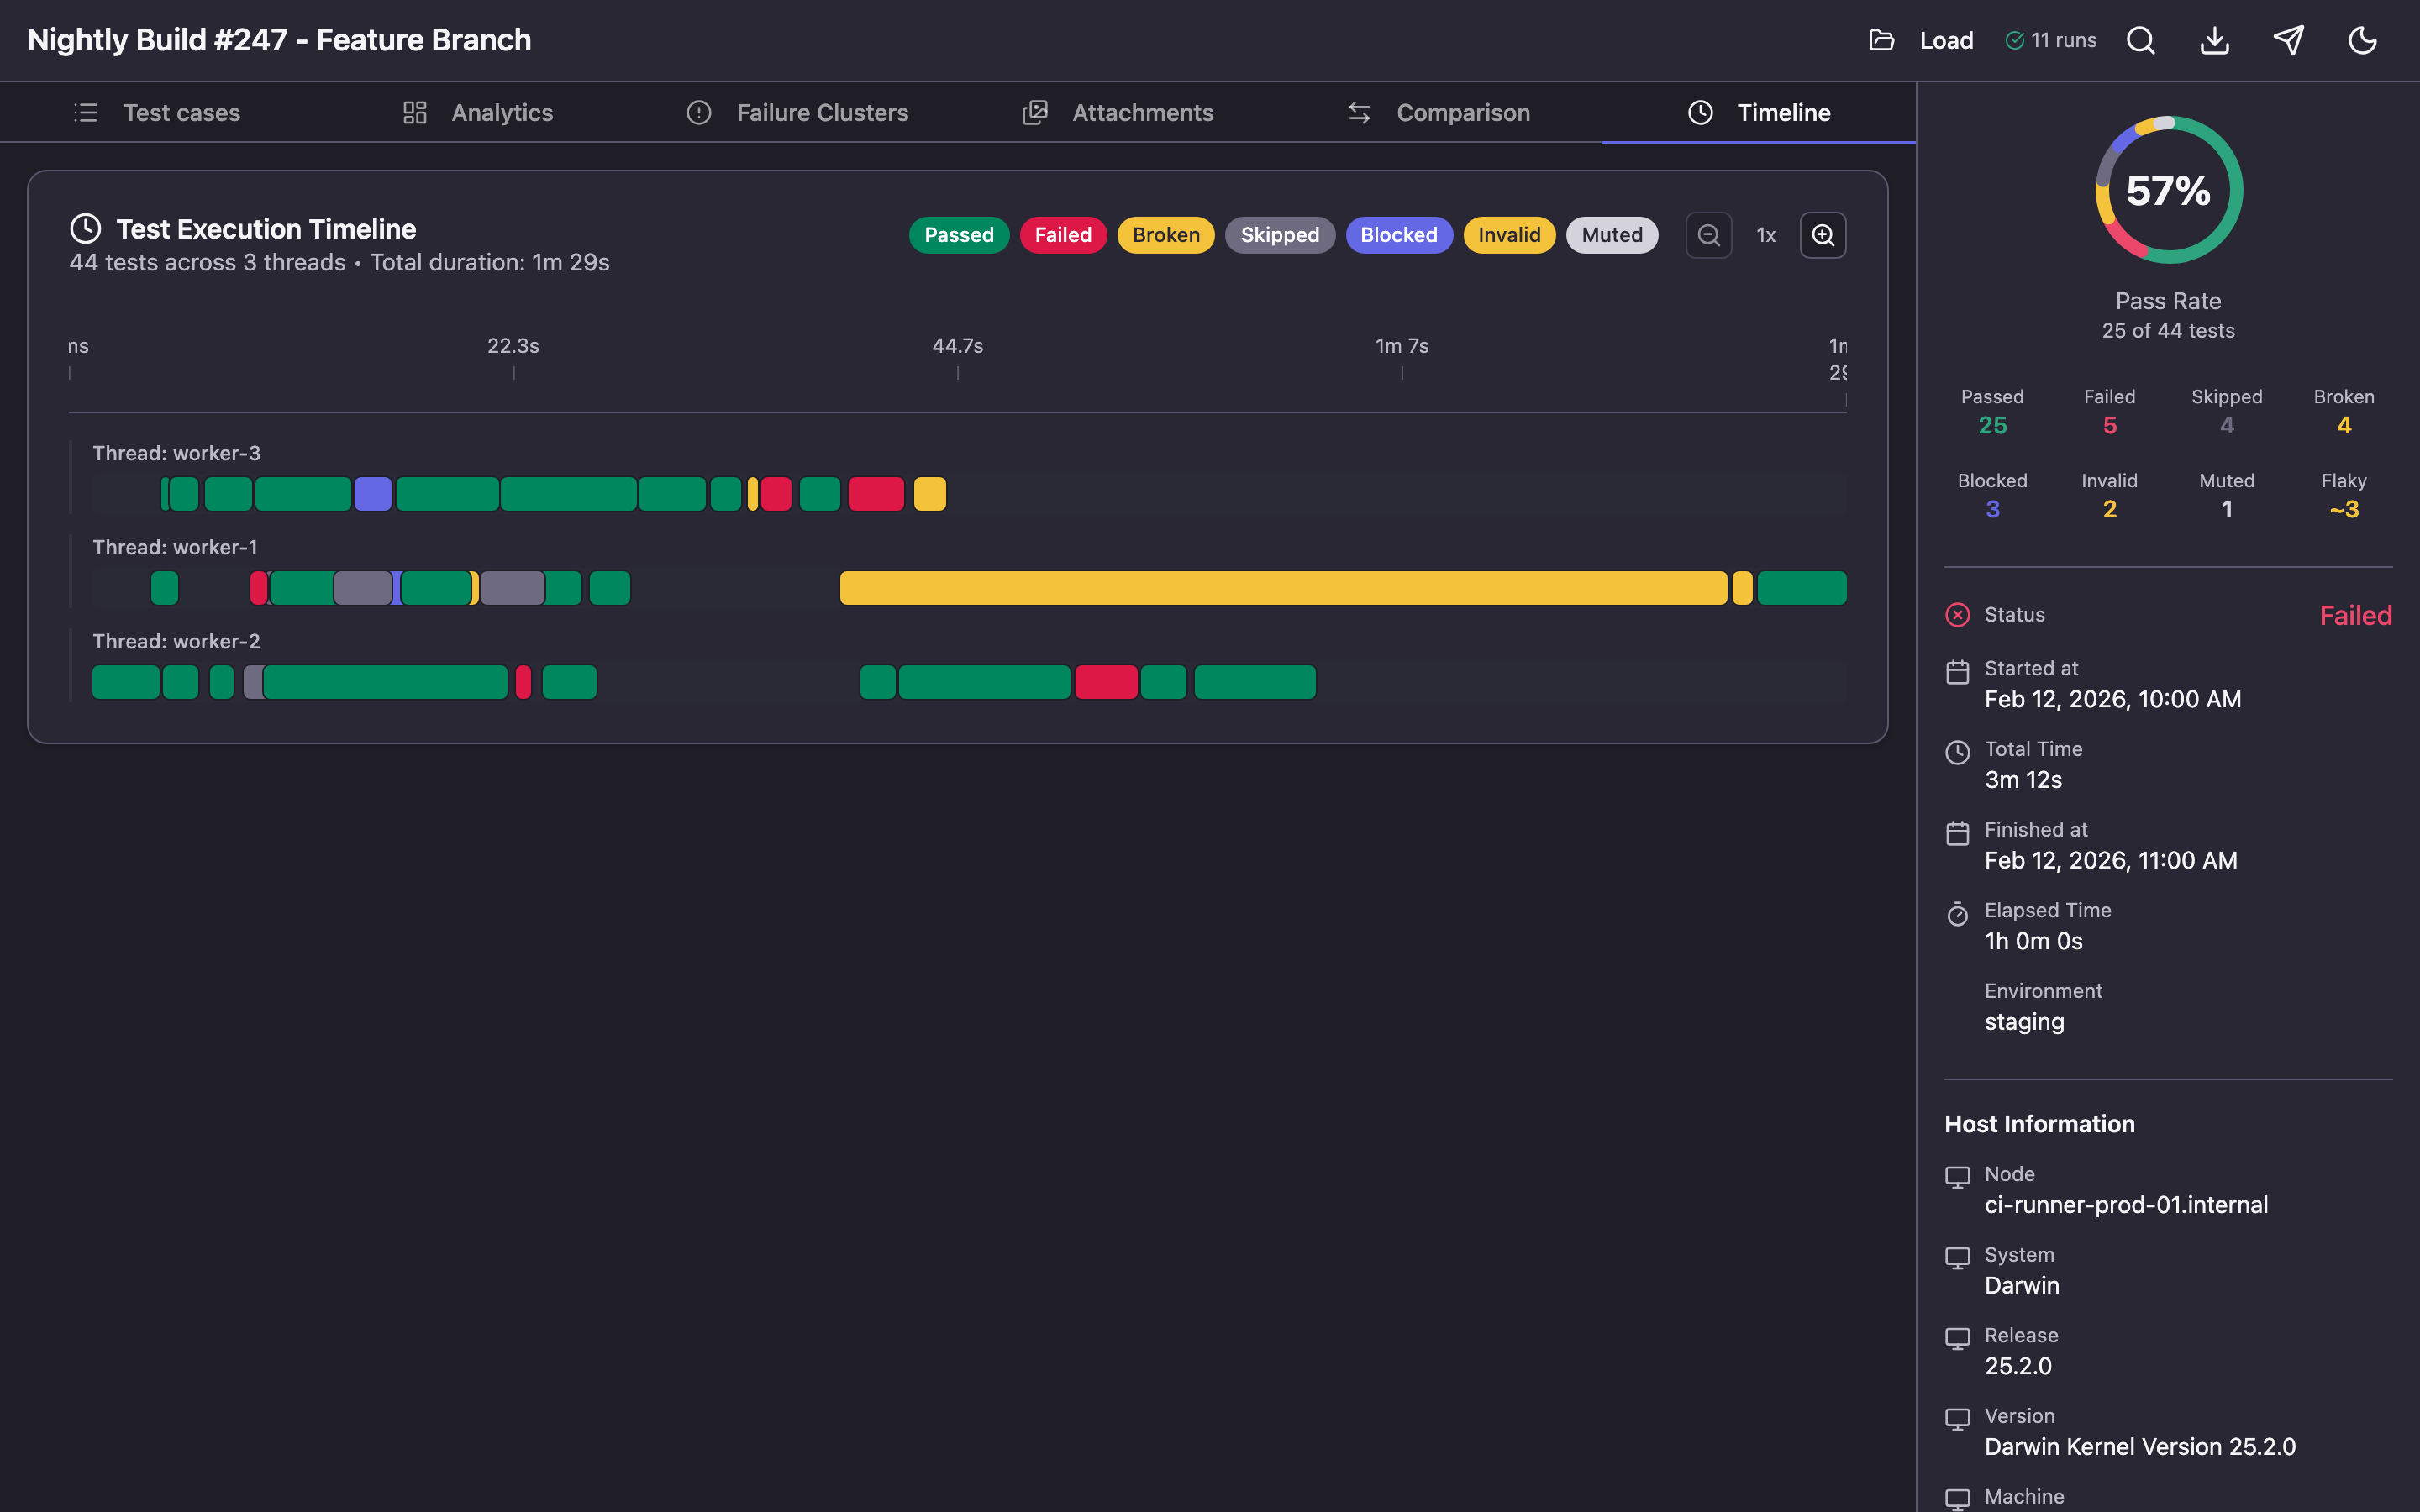
This is useful for:
- Parallelism analysis: is the load evenly distributed across workers?
- Finding bottlenecks: is there one long test holding up the entire run?
- Visually understanding test execution order
Zoom can be adjusted from 1x to 5x for detailed examination of specific segments.
Comparison — Run Comparison
When history is connected, the Comparison tab lets you compare two runs side by side.
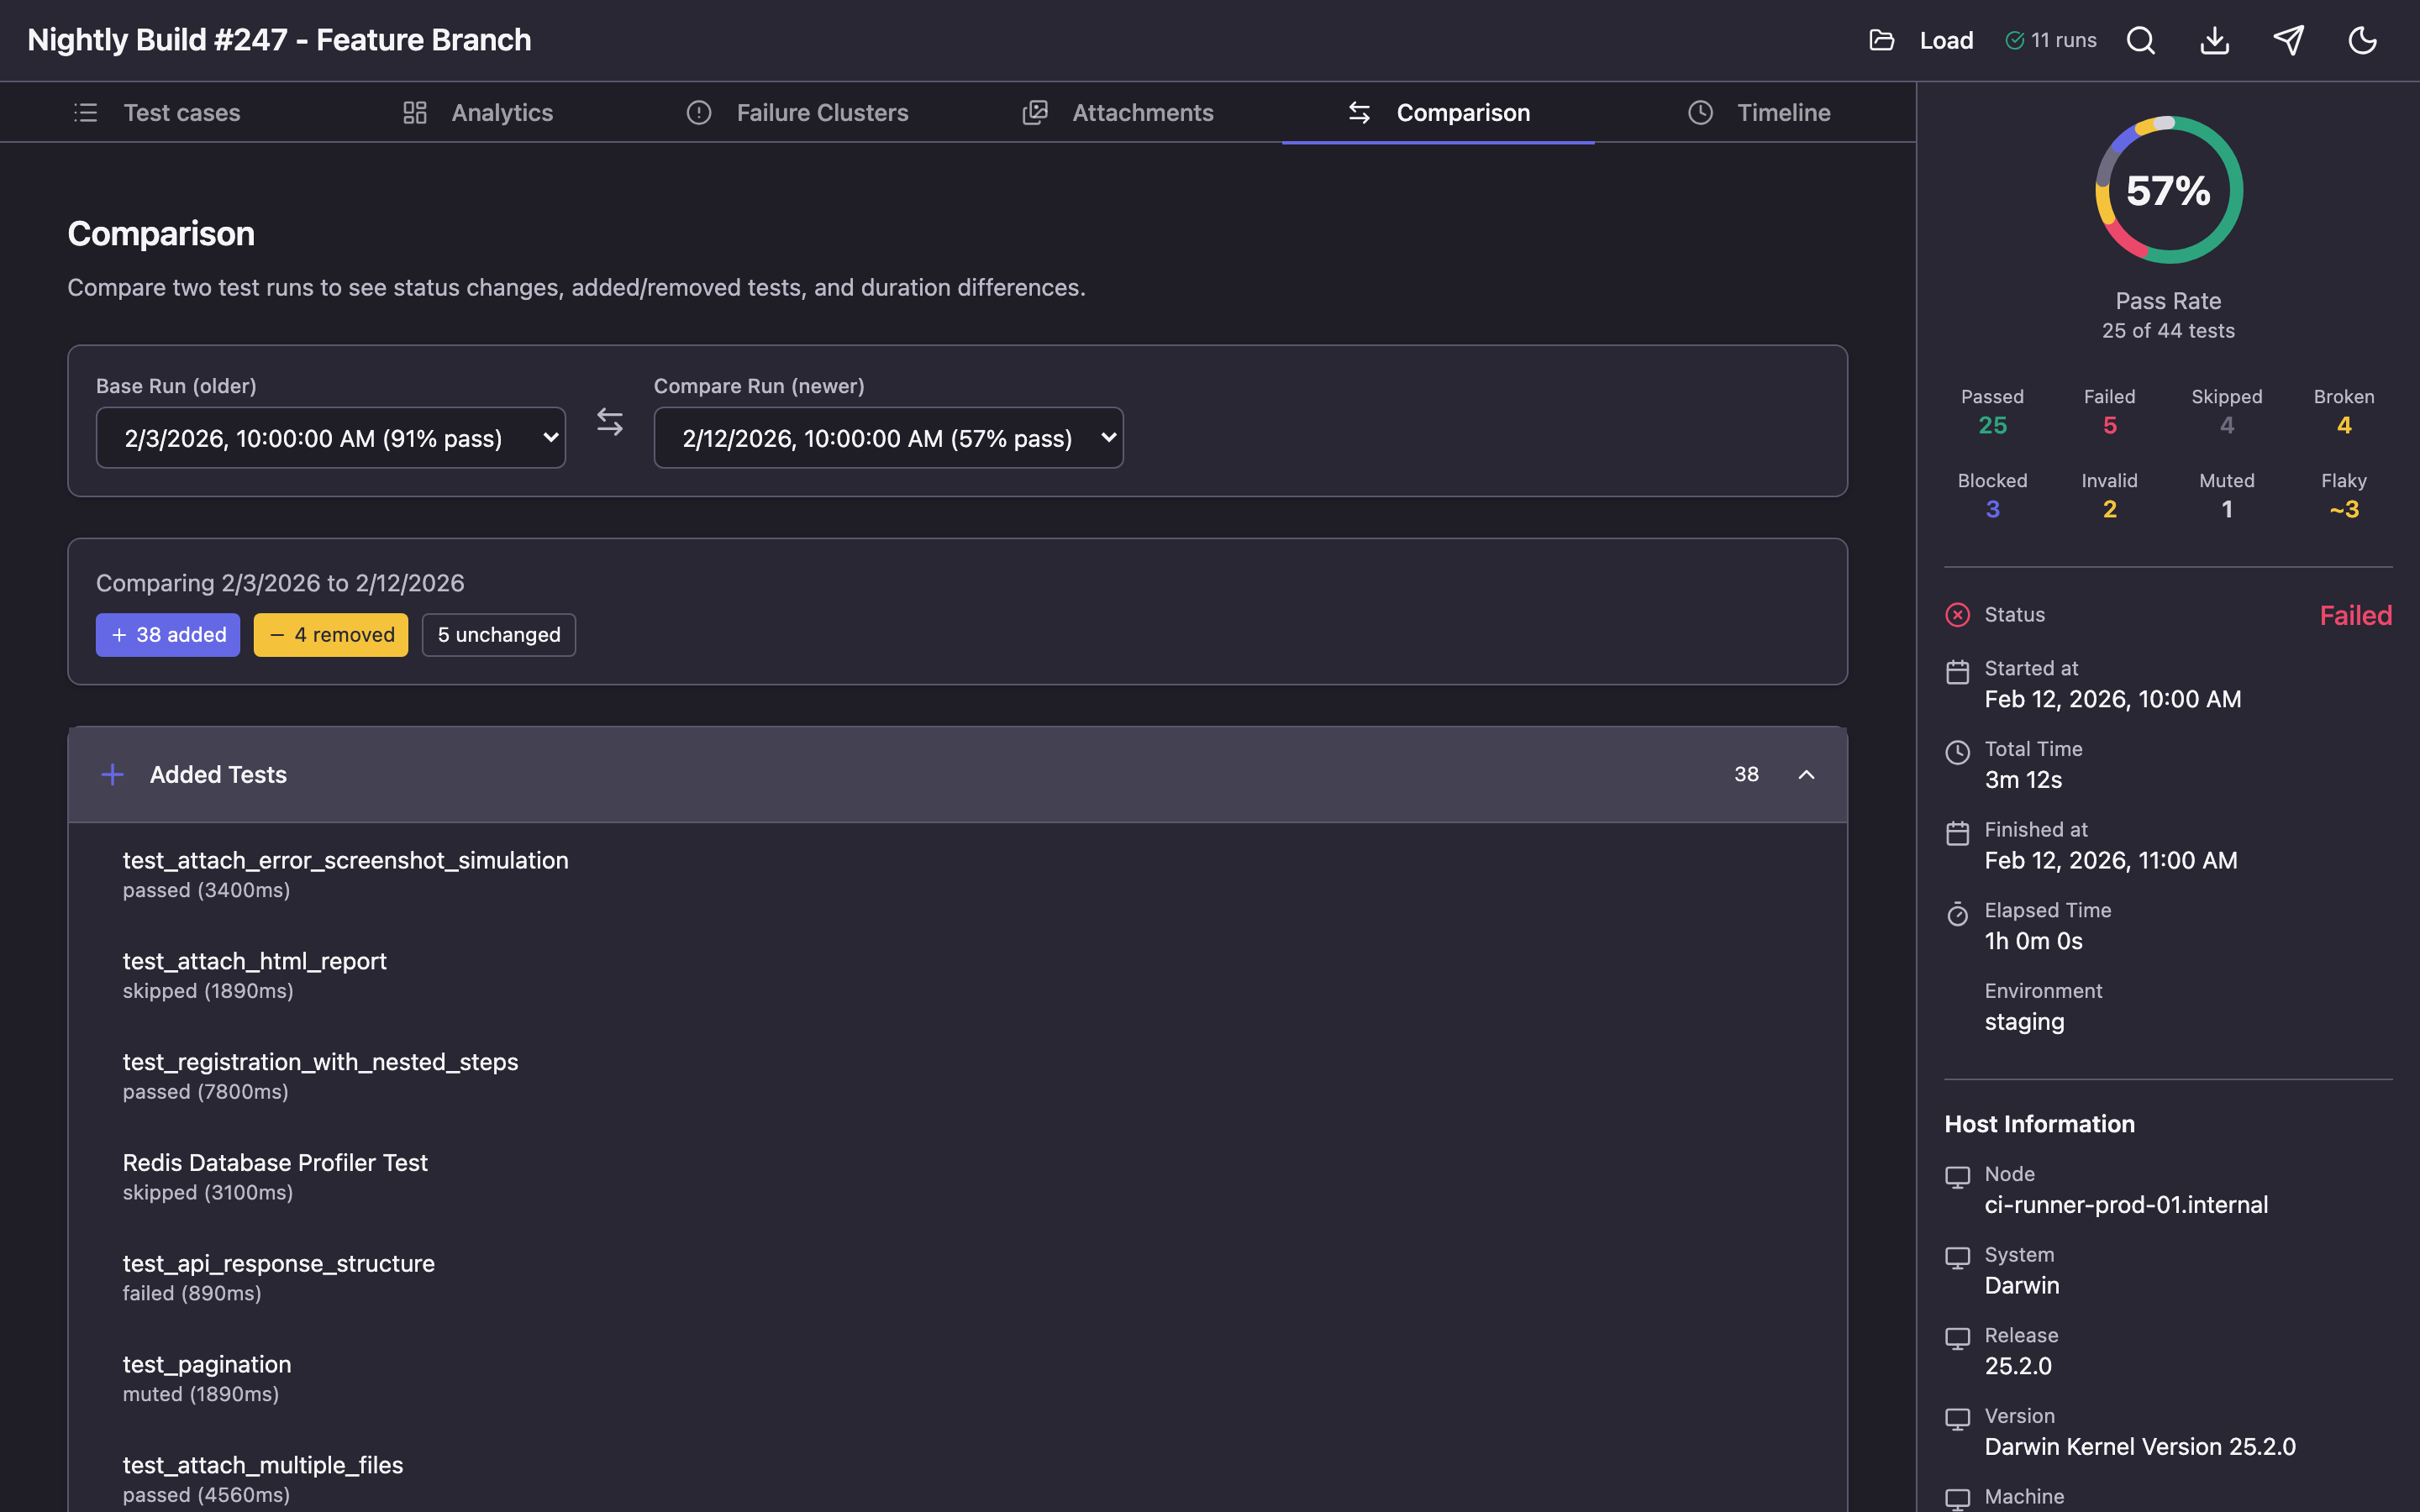
You'll see:
- Which tests changed status (e.g., passed → failed)
- Which tests were added or removed
- How each test's duration changed
- Summary statistics: pass rate difference, change counts by status
Traces — Playwright Traces
If your tests use Playwright and generate trace files, an additional Traces tab appears in the report. It allows interactive playback of browser test recordings: actions, screenshots at each step, and network requests.
Run History and Trend Analytics
One of Qase Report's key capabilities is working with history. When a history file is provided, the tool accumulates run data and delivers powerful analytics.
Connecting History
When using the open command, history is saved automatically:
qase-report open ./results -H ./qase-report-history.json
Each time you open a new report, run data is appended to the history file. For the generate command, history must be passed separately:
qase-report generate ./results -H ./qase-report-history.json -o report.html
What History Provides
After accumulating data across several runs, the following become available:
Pass rate trends — how the test pass rate changed from run to run. Useful for tracking overall project health.
Flaky test detection — the tool analyzes status alternations (pass → fail → pass) and identifies unstable tests. Requires a minimum of 5 runs.
Stability Score — each test receives a grade from A+ to F based on three factors:
- Pass rate (50% weight)
- Flakiness (30% weight)
- Duration consistency (20% weight)
Requires a minimum of 10 runs to calculate.
Performance regression detection — if a test's duration exceeds the mean + 2 standard deviations, the system generates an alert.
CI/CD Integration
In a CI/CD pipeline, the history file is typically stored as an artifact passed between runs:
# GitHub Actions example
- name: Download history
  uses: actions/download-artifact@v4
  with:
    name: qase-report-history
    path: ./results
  continue-on-error: true  # First run — no history yet

- name: Run tests
  run: pytest --qase ./results

- name: Generate report
  run: qase-report generate ./results -H ./results/qase-report-history.json -o report.html

- name: Upload report
  uses: actions/upload-artifact@v4
  with:
    name: test-report
    path: report.html

- name: Save history
  uses: actions/upload-artifact@v4
  with:
    name: qase-report-history
    path: ./results/qase-report-history.json
Sending Results to Qase TMS
If you use Qase TMS for test management, results can be sent directly from the report — no additional scripts or configuration needed.
When using the qase-report open command, a Send to Qase button appears in the report header. Click it to open a dialog with three fields:
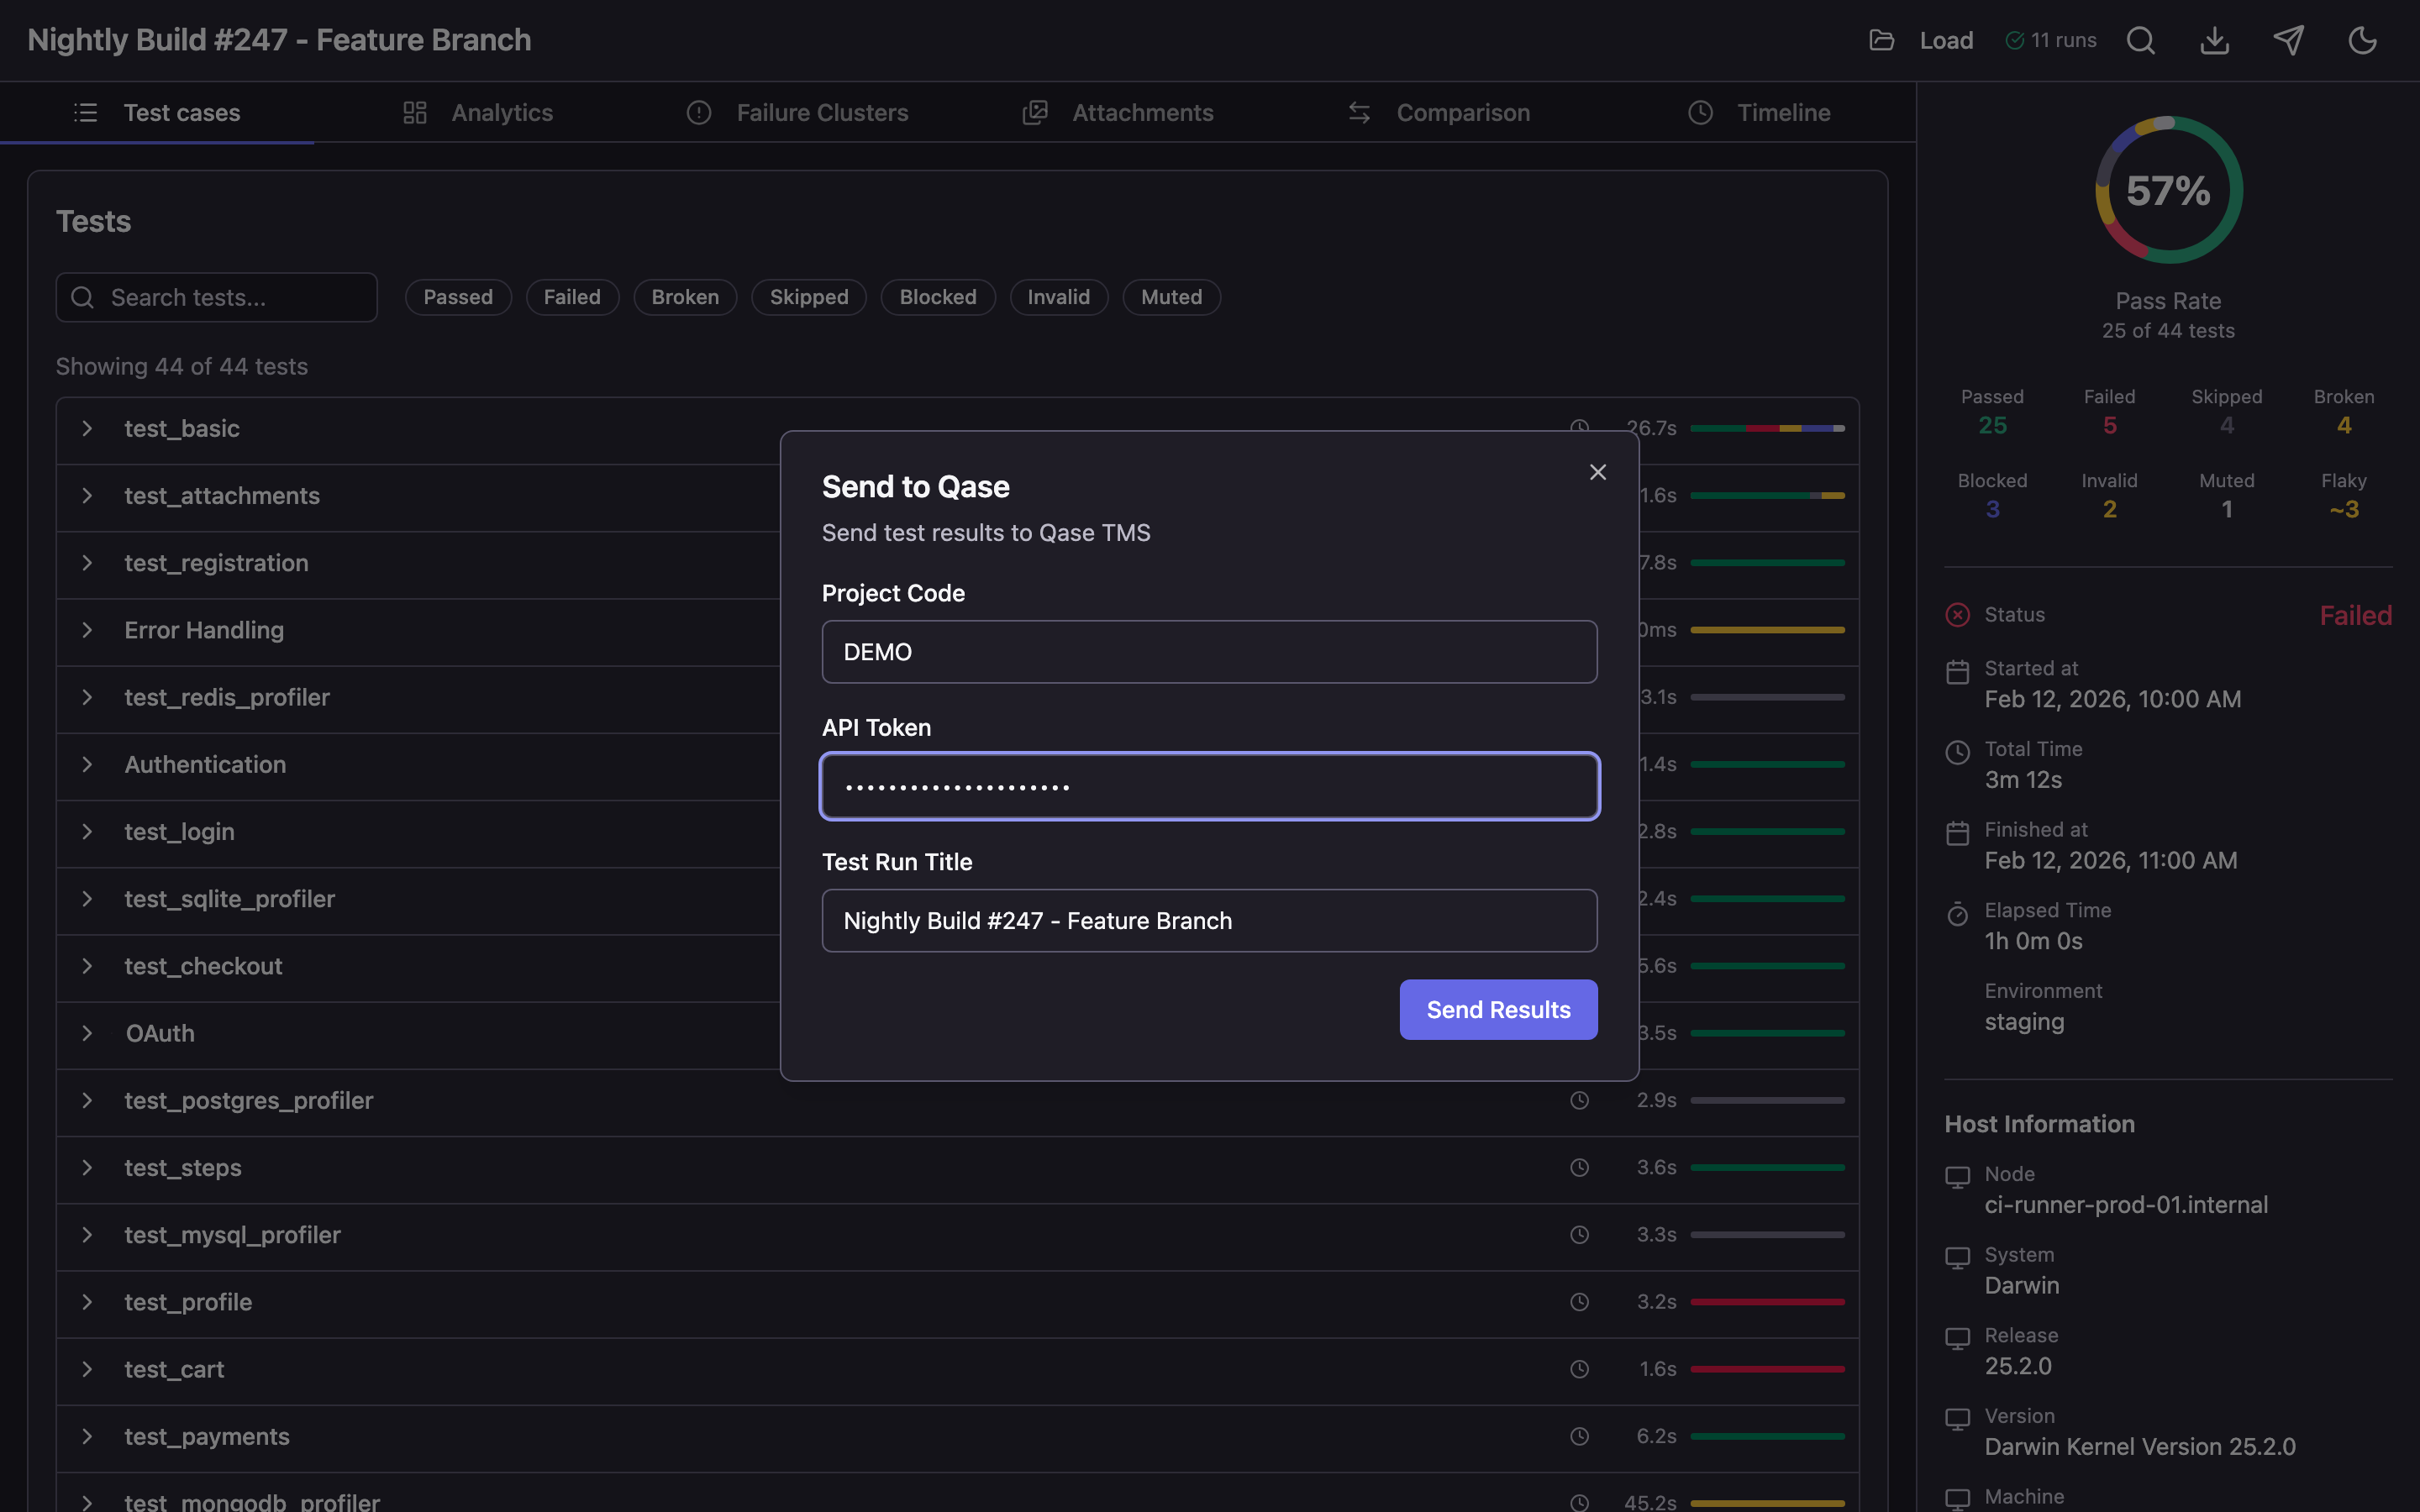
- Project Code — your project code in Qase (e.g.,
DEMO) - API Token — API token from your Qase account settings
- Test Run Title — run title (automatically populated from report data)
After clicking Send Results, the tool:
- Creates a new test run in Qase TMS
- Uploads attachments (screenshots, logs, files)
- Sends all test results with steps, errors, and parameters
- Completes the run
Once finished, you'll receive a link to view the run in Qase TMS.
This feature is only available in server mode (qase-report open). The send button is not shown in static HTML files.Additional Features
Dark and Light Themes
The report uses a dark theme by default. Switch to light theme via the icon in the top-right corner.
Loading a New Report
The "Load Report" button in the header lets you load a different results directory directly in the browser — without restarting the server.
Downloading the Report
The "Download" button in the header lets you download the current report as a standalone HTML file.
Summary
Qase Report solves three problems:
- Visualization — transforms raw JSON data into a clear, interactive report with filters, search, and navigation.
- Analytics — identifies flaky tests, performance regressions, and error patterns that are impossible to see from terminal output.
- Easy sharing — a single HTML file that opens in any browser without installation, configuration, or servers.
Getting started is one command:
npm install -g qase-report && qase-report open ./results
Project repository: github.com/qase-tms/qase-report


